2016-12-24

interconnect fragmentation kills the cluster

On a particular Oracle 2 node cluster (12.1) we faced random instances failing. Servicerequests at Oracle were open with limited result, as it was quite random and we could not link it to any trigger.
As it looked somehow like a communication problem between the 2 nodes, network team has checked the switches involved - without any outcome.
Even crashing instances were a problem already, it get worse one day when one node rebooted (according to the clusters alert.log and cssd.log due to network heartbeat issues) and then the clusterstack did not start anymore.

2016-12-12 03:35:34.203 [CLSECHO(54825)]CRS-10001: 12-Dec-16 03:35 AFD-9204: AFD device driver installed or loaded status: 'false' 
2016-12-12 09:17:25.698 [OSYSMOND(1247)]CRS-8500: Oracle Clusterware OSYSMOND process is starting with operating system process ID 1247 
2016-12-12 09:17:25.699 [CSSDAGENT(1248)]CRS-8500: Oracle Clusterware CSSDAGENT process is starting with operating system process ID 1248 
2016-12-12 09:17:25.854 [OCSSD(1264)]CRS-8500: Oracle Clusterware OCSSD process is starting with operating system process ID 1264 
2016-12-12 09:17:26.899 [OCSSD(1264)]CRS-1713: CSSD daemon is started in hub mode 
2016-12-12 09:17:32.220 [OCSSD(1264)]CRS-1707: Lease acquisition for node yyy2 number 2 completed 
2016-12-12 09:17:33.280 [OCSSD(1264)]CRS-1605: CSSD voting file is online: ORCL:ASM_OCR_VOTE_1; details in /xxx/app/grid/diag/crs/yyy1/crs/trace/ocssd.trc. 
2016-12-12 09:17:33.289 [OCSSD(1264)]CRS-1672: The number of voting files currently available 1 has fallen to the minimum number of voting files required 1. 
2016-12-12 09:27:25.925 [CSSDAGENT(1248)]CRS-5818: Aborted command 'start' for resource 'ora.cssd'. Details at (:CRSAGF00113:) {0:0:22951} in /xxx/app/grid/diag/crs/yyy2/crs/trace/ohasd_cssdagent_root.trc. 
2016-12-12 09:27:25.925 [OCSSD(1264)]CRS-1656: The CSS daemon is terminating due to a fatal error; Details at (:CSSSC00012:) in /xxx/app/grid/diag/crs/yyy2/crs/trace/ocssd.trc 
2016-12-12 09:27:25.926 [OCSSD(1264)]CRS-1603: CSSD on node yyy2 shutdown by user. 
Mon Dec 12 09:27:30 2016 
Errors in file /xxx/app/grid/diag/crs/yyy2/crs/trace/ocssd.trc (incident=857): 
CRS-8503 [] [] [] [] [] [] [] [] [] [] [] [] 
Incident details in: /xxx/app/grid/diag/crs/yyy/crs/incident/incdir_857/ocssd_i857.trc 

CSS trace is filled with messages reporting no connectivity with node1:
2016-12-12 09:27:20.375584 : CSSD:3154114304: clssscWaitOnEventValue: after CmInfo State val 3, eval 1 waited 1000 with cvtimewait status 4294967186 
2016-12-12 09:27:20.585624 :GIPCHALO:3141216000: gipchaLowerSendEstablish: sending establish message for node '0x7f7f900a37e0 { host 'yyy1', haName '480e-0dfa-bf94-bbda', srcLuid c33a92f9-675f2c44, dstLuid 00000000-00000000 numInf 1, sentRegister 0, localMonitor 0, baseStream 0x7f7f9009b110 type gipchaNodeType12001 (20), nodeIncarnation 9ec9e8e8-682809fa incarnation 2 flags 0x102804}' 
2016-12-12 09:27:20.633907 : CSSD:3635484416: clsssc_CLSFAInit_CB: System not ready for CLSFA initialization 
2016-12-12 09:27:20.633912 : CSSD:3635484416: clsssc_CLSFAInit_CB: clsfa fencing not ready yet 
2016-12-12 09:27:20.656587 : CSSD:3124418304: clssnmvDHBValidateNCopy: node 1, yyy1, has a disk HB, but no network HB, DHB has rcfg 371663236, wrtcnt, 11120596, LATS 232008644, lastSeqNo 11120595, uniqueness 1476197219, timestamp 1481534839/2789302712 
2016-12-12 09:27:20.868210 : CSSD:3119687424: clssnmSendingThread: Connection pending for node yyy1, number 1, flags 0x00000002 
2016-12-12 09:27:21.375702 : CSSD:3154114304: clssscWaitOnEventValue: after CmInfo State val 3, eval 1 waited 1000 with cvtimewait status 4294967186 
2016-12-12 09:27:21.585813 :GIPCHALO:3141216000: gipchaLowerSendEstablish: sending establish message for node '0x7f7f900a37e0 { host 'yyy1', haName '480e-0dfa-bf94-bbda', srcLuid c33a92f9-675f2c44, dstLuid 00000000-00000000 numInf 1, sentRegister 0, localMonitor 0, baseStream 0x7f7f9009b110 type gipchaNodeType12001 (20), nodeIncarnation 9ec9e8e8-682809fa incarnation 2 flags 0x102804}' 
2016-12-12 09:27:21.634038 : CSSD:3635484416: clsssc_CLSFAInit_CB: System not ready for CLSFA initialization 
2016-12-12 09:27:21.634046 : CSSD:3635484416: clsssc_CLSFAInit_CB: clsfa fencing not ready yet 
2016-12-12 09:27:21.657538 : CSSD:3124418304: clssnmvDHBValidateNCopy: node 1, yyy1, has a disk HB, but no network HB, DHB has rcfg 371663236, wrtcnt, 11120597, LATS 232009644, lastSeqNo 11120596, uniqueness 1476197219, timestamp 1481534840/2789303712 
2016-12-12 09:27:21.868336 : CSSD:3119687424: clssnmSendingThread: Connection pending for node yyy1, number 1, flags 0x00000002 
2016-12-12 09:27:22.375830 : CSSD:3154114304: clssscWaitOnEventValue: after CmInfo State val 3, eval 1 waited 1000 with cvtimewait status 4294967186 
2016-12-12 09:27:22.586063 :GIPCHALO:3141216000: gipchaLowerSendEstablish: sending establish message for node '0x7f7f900a37e0 { host 'yyy1', haName '480e-0dfa-bf94-bbda', srcLuid c33a92f9-675f2c44, dstLuid 00000000-00000000 numInf 1, sentRegister 0, localMonitor 0, baseStream 0x7f7f9009b110 type gipchaNodeType12001 (20), nodeIncarnation 9ec9e8e8-682809fa incarnation 2 flags 0x102804}' 
2016-12-12 09:27:22.634195 : CSSD:3635484416: clsssc_CLSFAInit_CB: System not ready for CLSFA initialization 
2016-12-12 09:27:22.634203 : CSSD:3635484416: clsssc_CLSFAInit_CB: clsfa fencing not ready yet 

After even more investigation on the Network another SR was filed.

Due to previous SRs oswatcher was installed already, and there we found the important information in the netstats segment:

zzz ***Fri Dec 9 14:54:54 GMT 2016 
Ip: 
13943376329 total packets received 
129843 with invalid addresses 
0 forwarded 
0 incoming packets discarded 
11934989273 incoming packets delivered 
11631767391 requests sent out 
2 outgoing packets dropped 
148375 fragments dropped after timeout 
2498052793 reassemblies required 
494739589 packets reassembled ok 
353229 packet reassembles failed 
411073325 fragments received ok 
2109526776 fragments created 

and after 2 minutes:
zzz ***Fri Dec 9 14:56:55 GMT 2016 
Ip: 
13943469180 total packets received 
129849 with invalid addresses 
0 forwarded 
0 incoming packets discarded 
11935067348 incoming packets delivered 
11631828206 requests sent out 
2 outgoing packets dropped 
148375 fragments dropped after timeout 
2498069258 reassemblies required 
494741345 packets reassembled ok 
359542 packet reassembles failed 
411073565 fragments received ok 
2109528513 fragments created 

The important part are the 6313 packet reassembles failed. In comparison to 16465 reassemblies required.

This led to some notes which describe both our symptoms (instance and cluster stack failure)

RHEL 6.6: IPC Send timeout/node eviction etc with high packet reassembles failure (Doc ID 2008933.1)

and

The CRSD is Intermediate State and Not Joining to the Cluster (Doc ID 2168576.1)


Reassembly happens when the sender wants so send more data than fits into a single packet. In this cluster the MTU size is 1500 - and in our example we had 16465 datagrams which needed to be reassembled, but 6131 failed. There are some variables in the Linux kernel, they can affect the buffer used in kernel to reassembly fragmented datagrams.

The solution for our system was to increase 2 parameters:

net.ipv4.ipfrag_high_thresh = 16777216
net.ipv4.ipfrag_low_thresh = 15728640 

These can be changed in the running system in
/proc/sys/net/ipv4/ipfrag_low_thresh
/proc/sys/net/ipv4/ipfrag_high_thresh
and for persistent changes in sysctl.conf

Unfortunately these parameters were not mentioned in any of the prerequisit scripts I found.

With all these knowledge, we identified an important difference to other clusters: This one is the only with MTU 1500 - so much more fragmented packages needed carehere.

After the issue itself was solved, I wondered if it can be found on a vanilla 12.1 crs installation.
(vanilla in comparison to our setup where oswatcher was installed due to the first SRs).
Yes, our beloved -MGMTDB holds the information already! It's in the documentation as well (Troubleshooting Oracle Clusterware) and in the output of oclumon dumpnodeview I can see
IPReasFail - Number of failures detected by the IPv4 reassembly algorithm
Node: yyy1 Clock: '16-11-26 06.55.27 Etc/GMT' SerialNo:443 
NICS: 
bond0 netrr: 159.021 netwr: 181.688 neteff: 340.709 nicerrors: 0 pktsin: 412 pktsout: 358 errsin: 0 errsout: 0 indiscarded: 0 outdiscarded: 0 inunicast: 412 innonunicast: 0 type: PUBLIC 
lo netrr: 37.722 netwr: 37.722 neteff: 75.443 nicerrors: 0 pktsin: 95 pktsout: 95 errsin: 0 errsout: 0 indiscarded: 0 outdiscarded: 0 inunicast: 95 innonunicast: 0 type: PUBLIC 
bond1 netrr: 2350.313 netwr: 42989.510 neteff: 45339.823 nicerrors: 0 pktsin: 1927 pktsout: 31345 errsin: 0 errsout: 0 indiscarded: 0 outdiscarded: 0 inunicast: 1927 innonunicast: 0 type: PRIVATE 
PROTOCOL ERRORS: 
IPHdrErr: 0 IPAddrErr: 102203 IPUnkProto: 0 IPReasFail: 59886 IPFragFail: 0 TCPFailedConn: 12598 TCPEstRst: 335559 TCPRetraSeg: 67276584 UDPUnkPort: 40134 UDPRcvErr: 0 

Unfortunately the format is kind of clumsy - I will need to dig into it's tables for a better output - especially for quick but powerful reports during problems.


During my research, I discovered it's not an oracle-only problem, others are affected as well (and provide a great description).


2016-11-20

cost vs. gets

Last week I hit an interesting performance issue:
A Table (T) has 2 index (of interest). One (IX_1) is only on column S, the other (IX_2) on (C, S).
The optimizer calculates the plan with IX_1 more expensive than the plan with IX_2 - as this should be more selective.
But the gets for the plan with IX_1 were less than those the optimizer preferred.

Here the information about the statement, index and plans.
As it's a real life example (just the object names are obfuscated) please do not wonder about the Partition operators. This statement only worked in the same subset of partitions - based on record_timestamp.


SELECT <columns>
FROM T WHERE S = :BIND0
         AND C = :BIND1
   AND record_timestamp > :BIND2
--       AND some more filters 

INDEX:

IX_1 C
IX_2 S, C


Plan1:
Plan hash value: 1749230273
------------------------------------------------------------------------------------------------------
| Id  | Operation                                     | Name            | Rows  | Bytes | Cost (%CPU)|
------------------------------------------------------------------------------------------------------
|   0 | SELECT STATEMENT                              |                 |   218 |   352K|   517   (1)|
|   1 |  SORT ORDER BY                                |                 |   218 |   352K|   517   (1)|
|*  2 |   FILTER                                      |                 |       |       |            |
|   3 |    PARTITION RANGE ITERATOR                   |                 |   218 |   352K|   516   (0)|
|   4 |     PARTITION LIST SINGLE                     |                 |   218 |   352K|   516   (0)|
|*  5 |      TABLE ACCESS BY LOCAL INDEX ROWID BATCHED| T               |   218 |   352K|   516   (0)|
|*  6 |       INDEX RANGE SCAN                        | IX_1            |   473 |       |    63   (0)|
------------------------------------------------------------------------------------------------------
consistent gets 27647

Plan2:
Plan hash value: 4278735161
------------------------------------------------------------------------------------------------
| Id  | Operation                                     | Name      | Rows  | Bytes | Cost (%CPU)|
------------------------------------------------------------------------------------------------
|   0 | SELECT STATEMENT                              |           |   218 |   352K|   505   (1)|
|   1 |  SORT ORDER BY                                |           |   218 |   352K|   505   (1)|
|*  2 |   FILTER                                      |           |       |       |            |
|   3 |    PARTITION RANGE ITERATOR                   |           |   218 |   352K|   504   (0)|
|   4 |     PARTITION LIST SINGLE                     |           |   218 |   352K|   504   (0)|
|*  5 |      TABLE ACCESS BY LOCAL INDEX ROWID BATCHED| T         |   218 |   352K|   504   (0)|
|*  6 |       INDEX RANGE SCAN                        | IX_2      |   461 |       |    63   (0)|
------------------------------------------------------------------------------------------------
consistent gets 33807


How could the optimizer be wrong, even all table and column statistics are correct?

It's just simple the relation between columns C and S: There can be many S for a given C, but a S always have a dedicated C. Both Index will provide the same ROWIDs for any given (C, S) - but as IX_1 is smaller than IX_2 - less gets are required.

But before we simply suggest just to hint (or outline, profile, patch, ...) the statement to use IX_1 some more information about the ongoing discussion:
As the application loops through all Cs, and for every C through all S, it might be more efficient to have all S per C (as in IX_2) in buffercache for the time C is of any interest - and afterwards do not care about those blocks at all. IX_1 would hit the same blocks quite often as the S are by no way grouped/ordered for any C. I'm not sure if we ever can make a reasonable testcase, as it's hard to bring the environment into a state without disturbing effects to measure such effects.

This is shows how easily the optimizer can be misguided, and even with reasonable knowledge about the data and application a decision for the "best" solution can be hard to impossible.

2016-10-25

no peek in PL/SQL

Connor McDonald wrote a blog about differences between bind peeking and SYS_CONTEXT in SQL queries. This even led to an proposal in Database Ideas: CBO should peek at SYS_CONTEXT values just like bind values (feel free to vote and comment, if you like it)
As I have a friend who really loves SYS_CONTEXT; I showed him the blog.

In the following discussion he stated (more/less
)
I should not have this problem at all, as I'm not using SYS_CONTEXT directly, but wrapped in a package like select * from xyz where a = pkg.get_ctxt('BLAH');

As a proud member of BAAG, I want clarify this should.

The preparation of my environment is nothing specific and quite close to Connors:

create table t ( x varchar2(10), y char(100));

insert into t
select 'a', rownum
from dual
/

insert into t
select 'b', rownum
from dual
connect by level <= 100000
/

commit;

create index ix on t ( x ) ;

exec dbms_stats.gather_table_stats('','T',method_Opt=>'for all columns size 5');

drop context blah;
create context blah using my_package;

create or replace PACKAGE MY_PACKAGE AS 

  procedure my_proc(p_val varchar2); 
  function get_sys_context return varchar2;
  function get_variable return varchar2;

END MY_PACKAGE;

create or replace package body MY_PACKAGE AS 
  my_var varchar2(10);
  procedure my_proc(p_val varchar2)  is
    begin
        my_var := p_val;
        sys.dbms_session.set_context('BLAH','ATTRIB',p_val);
    end my_proc;
    
  function get_sys_context return varchar2 is
    begin
      return sys_context('BLAH','ATTRIB');
    end get_sys_context;

  function get_variable return varchar2 is
    begin
      return my_var;
    end get_variable;

end MY_PACKAGE;


Now the real testcase starts:

exec my_package.my_proc('a');

select my_package.get_sys_context from dual;
select my_package.get_variable from dual;
Just shows everything works as expected:
PL/SQL procedure successfully completed.

GET_SYS_CONTEXT
---------------
a

GET_VARIABLE
---------------
a


So let's check the optimizers opinnion:
select /*+ gather_plan_statistics */ count(y)
from t
where x = my_package.get_sys_context;

select * from table(dbms_xplan.display_cursor(null,null,'ALLSTATS LAST'));
COUNT(Y)
----------
1


SQL_ID  2mgq2mrzd26j6, child number 0
-------------------------------------
select /*+ gather_plan_statistics */ count(y) from t where x = 
my_package.get_sys_context

Plan hash value: 2966233522

----------------------------------------------------------------------------------------------
| Id  | Operation          | Name | Starts | E-Rows | A-Rows |   A-Time   | Buffers | Reads  |
----------------------------------------------------------------------------------------------
|   0 | SELECT STATEMENT   |      |      1 |        |      1 |00:00:00.38 |    1507 |   1505 |
|   1 |  SORT AGGREGATE    |      |      1 |      1 |      1 |00:00:00.38 |    1507 |   1505 |
|*  2 |   TABLE ACCESS FULL| T    |      1 |  50001 |      1 |00:00:00.38 |    1507 |   1505 |
----------------------------------------------------------------------------------------------

Predicate Information (identified by operation id):
---------------------------------------------------

2 - filter("X"="MY_PACKAGE"."GET_SYS_CONTEXT"())

It seems optimizer doesn't like SYS_CONTEXT wrapped in a package.

select /*+ gather_plan_statistics */ count(y)
from t
where x = my_package.get_variable;

select * from table(dbms_xplan.display_cursor(null,null,'ALLSTATS LAST'));

COUNT(Y)
----------
1


SQL_ID  4ytd1pqx1yr09, child number 0
-------------------------------------
select /*+ gather_plan_statistics */ count(y) from t where x = 
my_package.get_variable

Plan hash value: 2966233522

----------------------------------------------------------------------------------------------
| Id  | Operation          | Name | Starts | E-Rows | A-Rows |   A-Time   | Buffers | Reads  |
----------------------------------------------------------------------------------------------
|   0 | SELECT STATEMENT   |      |      1 |        |      1 |00:00:00.16 |    1507 |   1504 |
|   1 |  SORT AGGREGATE    |      |      1 |      1 |      1 |00:00:00.16 |    1507 |   1504 |
|*  2 |   TABLE ACCESS FULL| T    |      1 |  50001 |      1 |00:00:00.16 |    1507 |   1504 |
----------------------------------------------------------------------------------------------

Predicate Information (identified by operation id):
---------------------------------------------------

2 - filter("X"="MY_PACKAGE"."GET_VARIABLE"())

The optimizer doesn't like the any pl/sql package function, regardless where the value comes from.

To bring it down to an even simpler construction:
CREATE OR REPLACE FUNCTION RETURN_BIND 
(
  BIND_IN IN VARCHAR2 
) RETURN VARCHAR2 AS 
BEGIN
  RETURN BIND_IN;
END RETURN_BIND;

variable b1 varchar2(10)
exec :b1 := 'a';

select RETURN_BIND(:b1) from dual;

select /*+ gather_plan_statistics */ count(y)
from t
where x = RETURN_BIND(:b1);

select * from table(dbms_xplan.display_cursor(null,null,'ALLSTATS LAST'));
COUNT(Y)
----------
         1


SQL_ID  84y4gdn5tmsb0, child number 0
-------------------------------------
select /*+ gather_plan_statistics */ count(y) from t where x = 
RETURN_BIND(:b1)
 
Plan hash value: 2966233522
 
----------------------------------------------------------------------------------------------
| Id  | Operation          | Name | Starts | E-Rows | A-Rows |   A-Time   | Buffers | Reads  |
----------------------------------------------------------------------------------------------
|   0 | SELECT STATEMENT   |      |      1 |        |      1 |00:00:00.18 |    1507 |   1505 |
|   1 |  SORT AGGREGATE    |      |      1 |      1 |      1 |00:00:00.18 |    1507 |   1505 |
|*  2 |   TABLE ACCESS FULL| T    |      1 |  50001 |      1 |00:00:00.18 |    1507 |   1505 |
----------------------------------------------------------------------------------------------
 
Predicate Information (identified by operation id):
---------------------------------------------------
 
   2 - filter("X"="RETURN_BIND"(:B1))

I hope this is enough evidence to claim, there is no bind peeking at the result of any PL/SQL function.

With this in mind, if you care for performance and your data might not be even distributed, take special care if you filter by the return value of any PL/SQL function (or SYS_CONTEXT).

This all was done in an unpatched 12.1 sandbox.

2016-10-11

OTN Appreciation Day : ONLINE

This post is inspired by Tim Hall.

Thinking about "what is my single favourite feature of Oracle", when all the products of Oracle (or at least all I know about) can be covered sounds stupid or impossible. There are far to many features which could be interesting, worth or made my life easier over my years in IT.
So I decided to pick something more generic.

The "feature" I like most is ONLINE

With every release of the Oracle database, more activities can be done ONLINE.
Of course, customers want to do everything online, and many features, especially when they are new, require any kind of downtime, create degregations during their use or simply lock objects exclusive.
But after spending some years with different releases, read discussions on OTN and other media, speak about details and interna on conferencces, a kind of pattern is visible:
Even if right now something is not ONLINE doable, people think about possibilities how it could work. Or sometimes they write tools to circumvent the limitations or at least mitigate them.
It then often happened - in one next release, the feature can be used ONLINE, without the limitations anymore.

2016-07-19

Oracle DIRECTORY access on OS layer

Oracle DIRECTORY objects are very nice to handle access for external tables or other procedures.
It just can be challenging to enable proper access to those files for other users than the database user (I call it oracle here).

If there are any concerns to allow any access to the databases host (except for DBAs and OS admins) it get's tricky fast.

One possibility is to use a NFS mount and make the directory available on the DB host as well as on another, where "the others" can access the files. A possible scenario is shown on the right. An export is mounted on the DB server and the other server as well. As the DB needs to write on this directory, user and group are oracle:dba. Unfortunately, on the other server the mount has an ownership 1001:1002 now, as there was no user oracle or group dba.
In an environment whith NFS mounts I highly recommend to keep the uid<->loginname, gid<->groupname mapping the same on all hosts (where the user/group exists) to avoid mostly unwanted side effects.
But with this setting otheruser (a given user on other server) can only read files in /oradir (given the default umask of 664), but not create files (in case oracle should read them) or delete files (when they are not used anymore).

To give otheruser more control about his files in this directory, we can create a group othergroup and assign oradir to it.

When setting oracle as member of this group as well, both users can manipulate files as long as they belong to othergroup. Unfortunately there is still a limitation: both users can deal with the files, IF they belong to othergroup. If otheruser has othergroup as primary group, that's easy from this side: Every file written by otheruser can be manipulated by oracle. The other way is more complex: a file written by oracle (e.g. a logfile of an external table) still has oracle:dba as user:group. Still otheruser can read it, but not delete it, e.g. after fixing issues, or just checking everything was right.

To enable both (otheruser and database) to read AND write any file in this directory, permissions must be adapted properly.

With setting chmod g+ws all members (not only primary) of othergroup can write into this directory AND if the process is member of othergroup, the group-id of the file is set to othergroup (not to the primary group of the process). With this setting, regardless who writes the file, the group is set so both can manipulate the file.


Now the setting is complete, and in a simple environment, at least after a reboot, everything will work smooth. But there are still some pitfalls:
  • as long as the database is not restarted, all existing processes (and those spawned by existing processes like jobs/scheduler processes) will not have the new groups
  • in clusterware environemnts, databases are started by oraagent. To restart it, I use (the undocumented)
    crsctl stop resource ora.crsd -init
    crsctl start resource ora.crsd -init
  • processes started by listener will as well suffer this limitation unless listener is restarted
  • in case of different users for clusterware and rdbms, the clusterware user must be considered as well
  • other problems might occur, e.g. with scripts in those directories.
Still this should show a introduction to a sane usage of DIRECTORY to exchange files with other os users.

2016-05-30

ORA-08176 with DB-link, create table and isolation level SERIALIZABLE

Today I had some fun identifying how a ORA-08176 can happen.
It started with a ticket similar to "we get an ORA-08176 during a select, please fix the database."
After some questions it refined to "we do a CREATE TABLE x AS SELECT in one session, and a SELECT * FROM X@db_link throws the ORA-08176.

That's enough for me to do a test-case, but I needed to change the isolation level to produce the error:

DB1DB2
create table obj_foo as select * from dba_objects;
set transaction isolation level SERIALIZABLE ;
select count(*) from obj_foo@DB2;

  COUNT(*)
----------
     98982
drop table obj_foo;
create table obj_foo as select * from dba_objects;
select count(*) from obj_foo@DB2;
select count(*) from obj_foo@DB2
*
ERROR at line 1:
ORA-08176: consistent read failure; rollback data not available
ORA-02063: preceding line from DB2

Just in case someone asks about
set transaction read only;

It also fails, but the error is slightly different in this case:
select count(*) from obj_foo@ROLIT01
*
ERROR at line 1:
ORA-01466: unable to read data - table definition has changed
ORA-02063: preceding line from ROLIT01

2016-02-10

if you write SQL, be specific!

Today  I got a ticket from a developer where he claimed Oracle has a bug somewhere. The reason for this claim was a statement similar to
SELECT *
FROM   table1
WHERE  tab1col1 IN
       (      SELECT 
tab1col1 
              FROM   table2)


This query returned rows.

But when he run the inner query on it's own, he received
ORA-00904: "TAB1COL1": invalid identifier
00904. 00000 -  "%s: invalid identifier"
as there is no column TAB1COL1 in TABLE2.

So why should there be any result for the full query when part of it fails already? Is oracle somehow ignoring the query on table2 totally due to some errors in optimization?

After some research and a 10053 trace (yes, it was not obvious for me) I saw Oracle doing a Cost‑based predicate pushdown (JPPD) and translates it to something like

AND  EXISTS (SELECT 0 FROM "TABLE2" WHERE "TABLE1"."TAB1COL1"="TABLE1"."TAB1COL1")

With this hint (for me, not  a /*+ syntax thing) it was obvious.

So my proposal was to be more specific and use alias like this:

SELECT g1.*
FROM   table1 t1
WHERE  t1.tab1col1 IN
       (      SELECT t2.
tab1col1 
              FROM   table2 t2)


to generate the expected ORA-904

2016-02-08

access to CHM raw data - without manipulating the -MGMTDB

In Version 12.1 Oracle introduced the Grid Infrastructure Management Repository (GIMR) called ‑MGMTDB.
This self managed pluggable database is a required component of Grid Infrastructure and should never require direct interactions. (there can be some interactions when you want to migrate to different diskgroups, but also those activities are covered within wrapper scripts provided by Oracle).
Every interaction with the data stored in this DB is done through applications - oclumon might be the best know. (If you prefer a graphical interface, you can check chmosg instead). Just as these are interfaces for the data stored on CHM user, Oracle does not provide any information how to connect to the database directly and query the data.
Of course I can always do a bequeath connection to the CDB, do a
alter session set container = <cluster_name>;

and query the tables directly. But sometimes I prefer to do queries from my PC, using sqldeveloper. So I was searching for CHMs password.

The probably most complicated way is to identify where the password could be stored. After some internet research I was sure it would be worth to check for a wallet stored in OCR. Even the docu does not show it, crsctl query wallet can show some details about a wallet called MGMTDB.

crsctl query wallet -type MGMTDB -all
CRS-10252: Aliases present in the wallet 'MGMTDB' are:
CHM
PCMRADMIN

So I know there is a wallet and it contains 2 credentials, but crsctl does not provide their passwords - at least I did not find out how.

So I have to go the longer way:

First get the proper entry from OCR:
ocrdump -keyname SYSTEM.WALLET.MGMTDB -xml /tmp/ocrdump.SYSTEM.WALLET.MGMTDB.xml

Then some transformation to get from
<name>SYSTEM.WALLET.MGMTDB</name>
<value_type>BYTESTREAM (16)</value_type>
<value>&lt;![CDATA[a1f84e370000000600000021.............
</value>

to a wallet which can be used by mkstore:
echo "cat //OCRDUMP/KEY/VALUE/text()" | \
xmllint --nocdata --shell /tmp/ocrdump.SYSTEM.WALLET.MGMTDB.xml |  \
head -n -1 | tail -n -1 | \
xxd -r -p > /tmp/ocrdump.SYSTEM.WALLET.MGMTDB.bin

Not that complicated at all. Now it's mkstore to query the details:
mkstore -wrl /tmp/ocrdump.SYSTEM.WALLET.MGMTDB.bin -list
Oracle Secret Store Tool : Version 12.1.0.2
Copyright (c) 2004, 2014, Oracle and/or its affiliates. All rights reserved.

Oracle Secret Store entries:
CHM
PCMRADMIN


It's quite similar to the previous result from crsctl query wallet - so we are nearly there!


mkstore -wrl /tmp/ocrdump.SYSTEM.WALLET.MGMTDB.bin \
-viewEntry CHM
Oracle Secret Store Tool : Version 12.1.0.2
Copyright (c) 2004, 2014, Oracle and/or its affiliates. All rights reserved.
 CHM = cRlu7yvFd7gZoYmqEl2Ye6jx143Iji

mkstore -wrl /tmp/ocrdump.SYSTEM.WALLET.MGMTDB.bin \
-viewEntry PCMRADMIN
Oracle Secret Store Tool : Version 12.1.0.2
Copyright (c) 2004, 2014, Oracle and/or its affiliates. All rights reserved.

 PCMRADMIN = mfqO8gPGFfzQZWPgyZhwO0pZk8zgSu

Here I have the passwords I'm looking for!

To connect to the -MGMTDB I need the listener information:
lsnrctl status MGMTLSNR

LSNRCTL for Linux: Version 12.1.0.2.0 - Production on 08-FEB-2016 10:52:00

Copyright (c) 1991, 2014, Oracle.  All rights reserved.

Connecting to (DESCRIPTION=(ADDRESS=(PROTOCOL=IPC)(KEY=MGMTLSNR)))
STATUS of the LISTENER
------------------------
Alias                     MGMTLSNR
Version                   TNSLSNR for Linux: Version 12.1.0.2.0 - Production
Start Date                24-JAN-2016 11:21:26
Uptime                    14 days 23 hr. 30 min. 33 sec
Trace Level               off
Security                  ON: Local OS Authentication
SNMP                      OFF
Listener Parameter File   /some_path/grid/grid_12102/network/admin/listener.ora
Listener Log File         /some_path/logs/grid/diag/tnslsnr/av3l958t/mgmtlsnr/alert/log.xml
Listening Endpoints Summary...
  (DESCRIPTION=(ADDRESS=(PROTOCOL=ipc)(KEY=MGMTLSNR)))
  (DESCRIPTION=(ADDRESS=(PROTOCOL=tcp)(HOST=1.2.3.4)(PORT=1521)))
  (DESCRIPTION=(ADDRESS=(PROTOCOL=tcp)(HOST=5.6.7.8)(PORT=1521)))
Services Summary...
Service "-MGMTDBXDB" has 1 instance(s).
  Instance "-MGMTDB", status READY, has 1 handler(s) for this service...
Service "_mgmtdb" has 1 instance(s).
  Instance "-MGMTDB", status READY, has 1 handler(s) for this service...
Service "crs908" has 1 instance(s).
  Instance "-MGMTDB", status READY, has 1 handler(s) for this service...
The command completed successfully

With all those bits and pieces I am able to connect to CHM@-MGMTDB:

CHM/cRlu7yvFd7gZoYmqEl2Ye6jx143Iji@1.2.3.4:1521/crs908 

It's not very practical, especially as the pasword can change for several reasons without notification, but still for any deeper data analysis it's handy to access the tables directly.

2016-01-15

Instance parameters derived from cpu_count - 12.1.0.2

About 6 years ago I wanted to know which instance parameters are derived from cpu_count. So it tested a 11.1.0.7 DB - in that version there 21 parameters changed based on the value of cpu_count.
Some DB versions passed by so I decided it's time for another check. This time it's 12.1.0.2 without any PSUs/patches. The machine is the same class as previous, so it took some time.

the script is nearly the same today:
!/usr/bin/ksh  -x

integer i=1
while ((i <= 128));
do
  print " $i ";

  echo "*.audit_file_dest='/appl/oracle/admin/BERX3_GLOBAL/adump'
*.audit_trail='db'
*.compatible='12.1.0.2.0'
*.control_files='/appl/oracle/oradata/BERX3_GLOBAL/controlfile/o1_mf_c9h3bxlw_.ctl','/appl/oracle/fast_recovery_area/BERX3_GLOBAL/controlfile/o1_mf_c9h3bxpg_.ctl'
*.db_block_size=8192
*.db_create_file_dest='/appl/oracle/oradata'
*.db_name='BERX3_GL'
*.db_recovery_file_dest='/appl/oracle/fast_recovery_area'
*.db_recovery_file_dest_size=4815m
*.db_unique_name='BERX3_GLOBAL'
*.diagnostic_dest='/appl/oracle'
*.remote_login_passwordfile='EXCLUSIVE'
*.sga_target=13g
*.undo_tablespace='UNDOTBS1'
*.cpu_count=$i" > /appl/home/oracle/instance_parameters/cpus/initBERX2_$i.ora

  echo "startup pfile='/appl/home/oracle/instance_parameters/cpus/initBERX2_$i.ora' ;

insert into init_parameters
select $i         ,
       a.ksppinm  ,
       b.ksppstvl ,
       c.ksppstvl
from x\$ksppi a, x\$ksppcv b, x\$ksppsv c
where a.indx = b.indx and a.indx = c.indx;

commit;

select distinct(\"CPUs\") from init_parameters;

shutdown;

exit;"> cpus/doit$i.sql

sqlplus "/ as sysdba" @cpus/doit$i.sql >cpus/log$i.log

sleep 5

  (( i = i + 1));
done

And all the values interesting is available again.
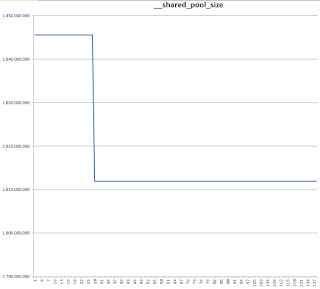
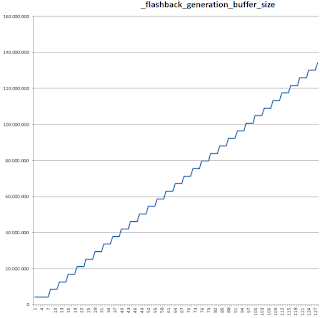
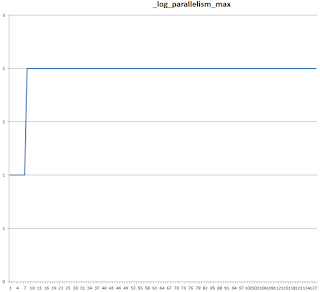
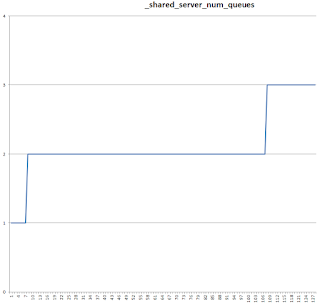
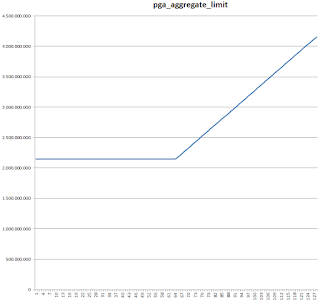
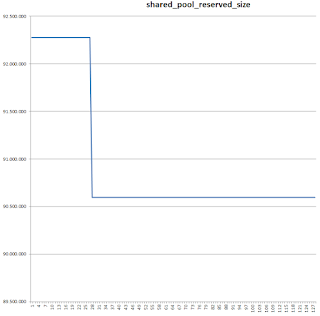
There are 40 parameters now changing value based on cpu_count - so a lot more of things which will change, when you "only" add/remove CPUs or alter instance caging.

Here are the graphs for 12.1.0.2 - and 11.1.0.7 if they exist already. Some look quite different.


__db_cache_size


11.1.0.7:


__java_pool_size


__large_pool_size


__shared_pool_size


11.1.0.7:


_cursor_db_buffers_pinned


11.1.0.7:


_db_block_buffers


11.1.0.7:


_db_block_lru_latches


11.1.0.7:


_db_handles


_enqueue_hash


_enqueue_hash_chain_latches


11.1.0.7:


_enqueue_locks


11.1.0.7:


_enqueue_resources


_flashback_generation_buffer_size


11.1.0.7:


_kghdsidx_count


11.1.0.7:


_log_parallelism_max


11.1.0.7:


_log_simultaneous_copies


11.1.0.7:


_max_outstanding_log_writes


_max_pending_scn_bcasts


_messages


_num_longop_child_latches


11.1.0.7:


_parallel_min_message_pool


11.1.0.7:


_px_proactive_slave_alloc_threshold


_session_allocation_latches


_shared_server_num_queues


11.1.0.7:


_small_table_threshold


11.1.0.7:


_spin_count


11.1.0.7:


_sqlmon_max_plan


11.1.0.7:


_use_single_log_writer

is TRUE for cpu_count 1..7 and ADAPTIVE for 8..128


db_writer_processes


11.1.0.7:


dml_locks


log_buffer


11.1.0.7:


parallel_max_servers


11.1.0.7:


parallel_min_servers


parallel_servers_target


pga_aggregate_limit


processes


sessions


shared_pool_reserved_size


transactions