Posts mit dem Label ASH werden angezeigt. Alle Posts anzeigen

2025-03-05

Sessionless Transactions - the moving target

Sessionless Transactions are quite new to Oracle. 
Some might argue this is not true: XA transactions are available since Oracle 7. 
The new Sessionless Transactions seem to be quite similar to global transactions - just without any central lock manager. 

Let's have a look how these new transactions can be observed during their lifetime.

I have a small setup of 4 sessions, the last one doesn't do a lot beside observing: 


select inst_id, sid, serial#, STATUS, module, SADDR, blocking_instance, blocking_session, final_blocking_instance, final_blocking_session  
from gv$session
where module like 'Session %'
order by 5;

   INST_ID        SID    SERIAL# STATUS   MODULE         SADDR            BLOCKING_INSTANCE BLOCKING_SESSION FINAL_BLOCKING_INSTANCE FINAL_BLOCKING_SESSION
---------- ---------- ---------- -------- -------------- ---------------- ----------------- ---------------- ----------------------- ----------------------
         5      48093      13343 INACTIVE Session A      000000115E3C4D90                                                                                  
         5      49891      61877 INACTIVE Session B      00000011463D1B18                                                                                  
         5      50497      51425 INACTIVE Session C      000000113E278D10                                                                                  
         5      43280      24898 ACTIVE   Session D      0000001139BCDBF0                                                                                                                                                                   
Now in Session A, the first transaction starts:

--SET APPINFO 'Session A'
set serveroutput on;
DECLARE
    gtrid VARCHAR2(128);
BEGIN
    gtrid := DBMS_TRANSACTION.START_TRANSACTION
      ( UTL_RAW.CAST_TO_RAW('Transaction Insert 1') 
      , DBMS_TRANSACTION.TRANSACTION_TYPE_SESSIONLESS
      , 2000 
      , DBMS_TRANSACTION.TRANSACTION_NEW
      );
   dbms_output.put_line(gtrid);
END;
/

5472616E73616374696F6E20496E736572742031


insert into sessionless (id) values (1);

1 row inserted.

and the observer sees:

  INST_ID        SID    SERIAL# STATUS   MODULE         SADDR            BLOCKING_INSTANCE BLOCKING_SESSION FINAL_BLOCKING_INSTANCE FINAL_BLOCKING_SESSION
---------- ---------- ---------- -------- -------------- ---------------- ----------------- ---------------- ----------------------- ----------------------
         5      48093      13343 INACTIVE Session A      000000115E3C4D90                                                                                  
         5      49891      61877 INACTIVE Session B      00000011463D1B18                                                                                  
         5      50497      51425 INACTIVE Session C      000000113E278D10                                                                                  
         5      43280      24898 ACTIVE   Session D      0000001139BCDBF0                                                                                  


select s.inst_id, s.sid, s.module, START_DATE, START_SCN , XID ,t.SES_ADDR --, t.*
from v$transaction t, gv$session s
where t.SES_ADDR = s.saddr (+);

   INST_ID        SID MODULE         START_DATE                START_SCN XID              SES_ADDR        
---------- ---------- -------------- ------------------- --------------- ---------------- ----------------
         5      48093 Session A      2025-03-05 13:03:08  44419149767413 09002000BA170000 000000115E3C4D90
         5      54695 SQL Developer  2025-03-05 08:51:39  44419144472312 0A000E00E9680000 000000116A24BC78
  
To make things more interesting (and observable) in Session B another transaction starts:

SET APPINFO 'Session B'
insert into sessionless (id) values (1);
 
and it hangs due to the PK on sessionless.id:
  
   INST_ID        SID    SERIAL# STATUS   MODULE         SADDR            BLOCKING_INSTANCE BLOCKING_SESSION FINAL_BLOCKING_INSTANCE FINAL_BLOCKING_SESSION
---------- ---------- ---------- -------- -------------- ---------------- ----------------- ---------------- ----------------------- ----------------------
         5      48093      13343 INACTIVE Session A      000000115E3C4D90                                                                                  
         5      49891      61877 ACTIVE   Session B      00000011463D1B18                 5            48093                       5                  48093
         5      50497      51425 INACTIVE Session C      000000113E278D10                                                                                  
         5      43280      24898 ACTIVE   Session D      0000001139BCDBF0                                                                                  
         
   INST_ID        SID MODULE         START_DATE                START_SCN XID              SES_ADDR        
---------- ---------- -------------- ------------------- --------------- ---------------- ----------------
         5      48093 Session A      2025-03-05 13:03:08  44419149767413 09002000BA170000 000000115E3C4D90
         5      49891 Session B      2025-03-05 13:04:04  44419149780350 08000900AC0D0000 00000011463D1B18
         5      54695 SQL Developer  2025-03-05 08:51:39  44419144472312 0A000E00E9680000 000000116A24BC78


select sql_exec_start, event,  BLOCKING_SESSION_STATUS, BLOCKING_SESSION, BLOCKING_SESSION_SERIAL#, BLOCKING_INST_ID, min(sample_time)mist , max(sample_time) mast
from v$active_session_history ash 
where session_id = 49891
  and sample_time > '2025-03-05 12:27:56.885000000' -- previous tests
group by  sql_exec_start, event,  BLOCKING_SESSION_STATUS, BLOCKING_SESSION, BLOCKING_SESSION_SERIAL#, BLOCKING_INST_ID;

SQL_EXEC_START      EVENT                          BLOCKING_SE BLOCKING_SESSION BLOCKING_SESSION_SERIAL# BLOCKING_INST_ID MIST                          MAST                         
------------------- ------------------------------ ----------- ---------------- ------------------------ ---------------- ----------------------------- -----------------------------
2025-03-05 13:04:04 enq: TX - row lock contention  VALID                  48093                    13343                1 2025-03-05 13:04:05.645000000 2025-03-05 13:05:02.696000000
  
Note the wrong BLOCKING_INST_ID? It should be 5, not 1!

Now the tricky part begins:
Session A gets rid of its transaction:
  
exec    DBMS_TRANSACTION.SUSPEND_TRANSACTION;

PL/SQL procedure successfully completed.
with slightly changes:
 
SQL_EXEC_START      EVENT                          BLOCKING_SE BLOCKING_SESSION BLOCKING_SESSION_SERIAL# BLOCKING_INST_ID MIST                          MAST                         
------------------- ------------------------------ ----------- ---------------- ------------------------ ---------------- ----------------------------- -----------------------------
2025-03-05 13:04:04 enq: TX - row lock contention  GLOBAL                                                                 2025-03-05 13:05:22.014000000 2025-03-05 13:06:37.285000000
2025-03-05 13:04:04 enq: TX - row lock contention  VALID                  48093                    13343                5 2025-03-05 13:05:19.980000000 2025-03-05 13:05:20.998000000
2025-03-05 13:04:04 enq: TX - row lock contention  VALID                  48093                    13343                1 2025-03-05 13:04:05.645000000 2025-03-05 13:05:18.962000000
And the blocking Session changed. After some time, the INST_ID got fixed. but more important, BLOCKING_SESSION_STATUS is GLOBAL now. Do you remember the similarities? 

 
When Session A disconnects:
 
   INST_ID        SID    SERIAL# STATUS   MODULE         SADDR            BLOCKING_INSTANCE BLOCKING_SESSION FINAL_BLOCKING_INSTANCE FINAL_BLOCKING_SESSION
---------- ---------- ---------- -------- -------------- ---------------- ----------------- ---------------- ----------------------- ----------------------
         5      49891      61877 ACTIVE   Session B      00000011463D1B18                                                                                  
         5      50497      51425 INACTIVE Session C      000000113E278D10                                                                                  
         5      43280      24898 ACTIVE   Session D      0000001139BCDBF0                                                                                  


   INST_ID        SID MODULE         START_DATE                START_SCN XID              SES_ADDR        
---------- ---------- -------------- ------------------- --------------- ---------------- ----------------
         5      43280 Session D      2025-03-05 13:08:38  44419149859826 07001E00290C0000 0000001139BCDBF0
         5      49891 Session B      2025-03-05 13:04:04  44419149780350 08000900AC0D0000 00000011463D1B18
         5      54695 SQL Developer  2025-03-05 08:51:39  44419144472312 0A000E00E9680000 000000116A24BC78
                                     2025-03-05 13:03:08  44419149767413 09002000BA170000 000000115E3C4D90
                                     
SQL_EXEC_START      EVENT                          BLOCKING_SE BLOCKING_SESSION BLOCKING_SESSION_SERIAL# BLOCKING_INST_ID MIST                          MAST                         
------------------- ------------------------------ ----------- ---------------- ------------------------ ---------------- ----------------------------- -----------------------------
2025-03-05 13:04:04 enq: TX - row lock contention  GLOBAL                                                                 2025-03-05 13:05:22.014000000 2025-03-05 13:09:03.785000000
2025-03-05 13:04:04 enq: TX - row lock contention  VALID                  48093                    13343                5 2025-03-05 13:05:19.980000000 2025-03-05 13:05:20.998000000
2025-03-05 13:04:04 enq: TX - row lock contention  VALID                  48093                    13343                1 2025-03-05 13:04:05.645000000 2025-03-05 13:05:18.962000000                                     
we see v$transaction has an orphaned SADDR

Now Session C picks up:
 
  set serveroutput on;
DECLARE
    gtrid VARCHAR2(128);
BEGIN
    gtrid := DBMS_TRANSACTION.START_TRANSACTION
         (UTL_RAW.CAST_TO_RAW('Transaction Insert 1') 
        , DBMS_TRANSACTION.TRANSACTION_TYPE_SESSIONLESS
        , 2000
        , DBMS_TRANSACTION.TRANSACTION_RESUME);
END;
/

PL/SQL procedure successfully completed.
which leads to 
   
   INST_ID        SID MODULE         START_DATE                START_SCN XID              SES_ADDR        
---------- ---------- -------------- ------------------- --------------- ---------------- ----------------
         5      43280 Session D      2025-03-05 13:08:38  44419149859826 07001E00290C0000 0000001139BCDBF0
         5      49891 Session B      2025-03-05 13:04:04  44419149780350 08000900AC0D0000 00000011463D1B18
         5      54695 SQL Developer  2025-03-05 08:51:39  44419144472312 0A000E00E9680000 000000116A24BC78
                                     2025-03-05 13:03:08  44419149767413 09002000BA170000 000000115E3C4D90  

SQL_EXEC_START      EVENT                          BLOCKING_SE BLOCKING_SESSION BLOCKING_SESSION_SERIAL# BLOCKING_INST_ID MIST                          MAST                         
------------------- ------------------------------ ----------- ---------------- ------------------------ ---------------- ----------------------------- -----------------------------
2025-03-05 13:04:04 enq: TX - row lock contention  VALID                  50497                    51425                1 2025-03-05 13:09:51.587000000 2025-03-05 13:11:19.137000000
2025-03-05 13:04:04 enq: TX - row lock contention  GLOBAL                                                                 2025-03-05 13:05:22.014000000 2025-03-05 13:09:50.568000000
2025-03-05 13:04:04 enq: TX - row lock contention  VALID                  48093                    13343                5 2025-03-05 13:05:19.980000000 2025-03-05 13:05:20.998000000
2025-03-05 13:04:04 enq: TX - row lock contention  VALID                  48093                    13343                1 2025-03-05 13:04:05.645000000 2025-03-05 13:05:18.962000000
we see v$transaction still does not know about Session B now holding 09002000BA170000 . But at the same time, ASH shows multiple lines of (the same) blocking status. Of course, to release all the tension, Session B does a simple rollback - and everything is fine.

2023-01-14

OEM: ASH Package Version Status - manual update

Oracle Enterprise Manager is a perpetual well of joy! 

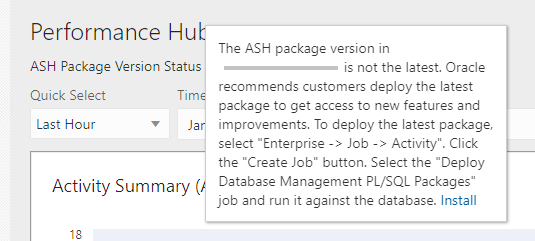
In the Performance Hub page, it can show a yellow warning sign (⚠️). I didn't see any degradation because if this, but my inner Monk is disturbed, So I have to fix it. 

This warning sign gibes a little information about an ASH package version and how it should be replaced. 
For some reasons it's not always that easy to run these jobs (or they run, but the triangle doesn't disappear). However, there is a quite straight forward method to deploy the proper packages, make the triangle disappear (and my Monk happy): 
the Scripts which need to be applied to the target DB are located on the OMS host in 
<OMS_HOME>middleware/plugins/oracle.sysman.db.oms.plugin_*/sql/db/latest/instance/ 
(or whatever the plugin version is). 
The files there are 

.
└── middleware
    └── plugins
        └── oracle.sysman.db.oms.plugin_13.5.1.0.0
            └── sql
                └── db
                    └── latest
                        └── instance
                            ├── ashviewer_pkgbodys.sql
                            ├── ashviewer_pkgdefs.sql
                            ├── dbms_compare_period.sql
                            ├── eaddm_pkgbody.sql
                            ├── eaddm_pkgdef.sql
                            ├── omc_ashv_pkg_body.sql
                            ├── omc_ashv_pkg.sql
                            ├── priv_grant_omc_ash.sql
                            ├── prvs_awr_data_cp.sql
                            ├── prvs_awr_data.sql
                            ├── prvt_awr_data_cp.sql
                            ├── prvt_awr_data.sql
                            ├── prvt_compare_period.sql
                            ├── README.txt
                            └── test.sql
                            

Not all these files are required. in fact, only these 3: 

omc_ashv_pkg.sql omc_ashv_pkg_body.sql priv_grant_omc_ash.sql

To apply them into DBSNMP, it's required to grant execute on DBMS_SQL and DBMS_LOB to DBSNMP. The 3 scripts must be executed as DBSNMP. 

With these steps, OEM is happy and the warning is gone. - everything is fine. (and especially for automated mass deployments, I see it harder to schedule some jobs in OEM and hope for their success, than simply run some scripts).


Just for the curious, the (more important from my perspective) parts of the package are

PACKAGE omc_ash_viewer

...


  REPORT_INTERNAL_VERSION CONSTANT VARCHAR2(64) := '53';

  -- date format to be used for communications with package.
  ASH_TIME_FORMAT CONSTANT VARCHAR2(30) := 'MM/DD/YYYY HH24:MI:SS';

  -- error ratio to be acceptable for not mixing in-memory with on disk.
  -- We set it to 1 to always mix memory and disk in cases where neither 
  -- covers all the time period.
  ASH_ALLOWED_ERR_RATIO CONSTANT NUMBER := 1;

  -- -----------------------------------------------------
  -- controlling the number of buckets.
  -- constants are for settings of "LOW", "MEDIUM", "HIGH"
  -- 
  -- The setting of "MAX" (or "ALL") is: 
  --  same number of buckets as high, but no down sampling
  -- -----------------------------------------------------
  ASH_LOW_RESOLUTION CONSTANT VARCHAR2(10) := 'LOW';
  ASH_LOW_BUCKETS CONSTANT NUMBER := 120;
  ASH_LOW_ROWS_PER_BUCKET CONSTANT NUMBER := 20;
  ASH_MED_RESOLUTION CONSTANT VARCHAR2(10) := 'MEDIUM';
  ASH_MED_BUCKETS CONSTANT NUMBER := 180;
  ASH_MED_ROWS_PER_BUCKET CONSTANT NUMBER := 35;
  ASH_HIGH_RESOLUTION CONSTANT VARCHAR2(10) := 'HIGH';
  ASH_HIGH_BUCKETS CONSTANT NUMBER := 360;
  ASH_HIGH_ROWS_PER_BUCKET CONSTANT NUMBER := 50;
  ASH_MAX_RESOLUTION CONSTANT VARCHAR2(10) := 'MAX';
  
  
  -- default REAL TIME min bucket size in seconds
  ASH_DEF_MEM_BUCKET_SIZE CONSTANT NUMBER := 10;

  -- default Historical min bucket size in seconds
  ASH_DEF_DISK_BUCKET_SIZE CONSTANT NUMBER := 20;

  -- length of SQL text to fetch
  ASH_DEF_SQLTEXT_LEN CONSTANT NUMBER := 200;

  -- database version constants
  VER_12_2 CONSTANT VARCHAR2(12) := '1202000000';
  VER_12_1_2 CONSTANT VARCHAR2(12) := '1201000200';
  VER_12_1 CONSTANT VARCHAR2(12) := '1201000000';
  VER_12   CONSTANT VARCHAR2(12) := '1200000000';
  VER_11_MIN CONSTANT VARCHAR2(12) := '1102000200';
  VER_19   CONSTANT VARCHAR2(12) := '1900000000';
  VER_20   CONSTANT VARCHAR2(12) := '2000000000';

  TOP_ADD_INFO_COUNT      CONSTANT BINARY_INTEGER := 20;
  MAX_INFO_TIME_LIMIT     CONSTANT BINARY_INTEGER := 2;

  -- menu categories --
  -- when you add a new category here, make sure to visit the function
  -- generate_menu_xml and add the category there.
  RSRC_CONS_CAT           CONSTANT VARCHAR2(128) := 'resource_consumption_cat';
  SESS_ID_CAT             CONSTANT VARCHAR2(128) := 'session_identifiers_cat';
  SESS_ATTR_CAT           CONSTANT VARCHAR2(128) := 'session_attributes_cat';
  SQL_CAT                 CONSTANT VARCHAR2(128) := 'sql_cat';
  PLSQL_CAT               CONSTANT VARCHAR2(128) := 'pl_sql_cat';
  TARGET_CAT              CONSTANT VARCHAR2(128) := 'target_category';


  -- -------------------------------------------------------------------------
  --                      error number constants
  -- -------------------------------------------------------------------------
  ERR_DIMNAME_TOO_LONG CONSTANT NUMBER := -13720;
  ERR_DIMNAME_INVALID  CONSTANT NUMBER := -13721;

  -- str_to_ascii converts a string in the DB language and character set to 
  -- ASCII8 that is safe to use in XML and XMLCDATA elements. Special 
  -- characters are masked based on UTF16 standard of \xxxx using asciistr 
  -- SQL function.
  FUNCTION str_to_ascii(s IN VARCHAR) RETURN VARCHAR;

  -- ------------------------------------------------------------------------
  -- ------------------------------------------------------------------------
  -- getSqlText
  --   Returns the text and command of a SQL (if found) as an XML document
  --   Data sources are gv$sql and AWR.
  --   In case of a PDB: if AWR snapshots are taken regularly in the PDB,
  --   The AWR data source is AWR_PDB_SQLTEXT, otherwise it is AWR_ROOT_SQLTEXT
  --
  --   Arguments:
  --     p_dbid: the dbid to use.
  --             NULL: fetch from the local RDBMS
  --             If it matches the local dbid or con_dbid, fetch local.
  --             Otherwise, assume imported snapshots.
  --     p_sql_ids: the sql_id values we are interested in.
  --             Option 1: commad separated list with no spaces.
  --             Option 2: XML document in the format 
  --     <sqlid><m v="1q1spprb9m55h"></m><m v="a2k1zqcbp5nxf"</m></sqlid>
  -- 
  --   Returns: XML document containing the data, only of SQL that were found.
  --   The format is:
  --    <sqlid>
  --          <m v="1q1spprb9m55h" op="SELECT">
  --             <![CDATA[WITH MONITOR_DATA AS (SELECT INST_ID, KE ... ]]></m>
  --          <m v="a2k1zqcbp5nxf" op="INSERT">
  --             <![CDATA[insert into foo values(2)]]></m>
  --    </sqlid>
  --
  --   SQL text is truncated to size ASH_DEF_SQLTEXT_LEN, same as data APIs
  -- ------------------------------------------------------------------------
  -- ------------------------------------------------------------------------
  FUNCTION getSqlText(p_dbid IN NUMBER, p_sql_ids IN VARCHAR)
  RETURN   XMLTYPE;

  -- ------------------------------------------------------------------------
  -- ------------------------------------------------------------------------
  -- fetch_sqltext
  --   Returns the text and command of a SQL (if found) as an XML element
  -- Subject to time limit: may return NULL if no time is left.
  -- p_sqlid: the SQL ID of the SQL we are looking for.
  -- p_is_local: 'y' if the data is from the RDBMS we query
  --             any other value indicates an imported AWR snapshot
  -- p_dbid and p_con_dbid: In case of a local (p_is_local = 'y') p_dbid
  --             is the root's dbid and p_con_dbid is the PDB's dbid.
  --             p_con_dbid can be null in case of old RDBMS, or in case
  --             we are using a standard RDBMS.
  -- p_is_pdb: 'y' if it is a local query from inside a pdb.
  -- p_is_old: 'y' if the local RDBMS version is 12.1 or below. 
  -- p_time_limit: 'y' if we are bound by time limit. 
  --
  -- We may search for SQL text in various places depending on the situation.
  -- Order of search for the various cases:
  --  A. Local snapshots, Non-CDB RDBMS or Root of CDB:
  --     1. V$SQL using sql_id
  --     2. DBA_HIST_SQLTEXT using sql_id, root_dbid
  --  
  --  B. Local snapshots, inside PDB, version 12.1 (is_old)
  --     1. V$SQL using sql_id
  --     2. DBA_HIST_SQLTEXT using sql_id, root_dbid
  --  
  --  C. Local snapshots, inside PDB, versions 12.2 and above
  --     1. V$SQL using sql_id
  --     2. AWR_PDB_SQLTEXT using sql_id, con_dbid
  --     2. AWR_ROOT_SQLTEXT using sql_id, root_dbid
  --  
  --  D. Imported snapshots, standard RDBMS or Root of CDB
  --     1. DBA_HIST_SQLTEXT using sql_id, dbid
  --  
  --  E. Imported snapshots, PDB versions 12.2 and onwards
  --     1. WR_PDB_SQLTEXT using sql_id, dbid
  -- ------------------------------------------------------------------------
  -- ------------------------------------------------------------------------
  FUNCTION fetch_sqltext(p_sqlid IN VARCHAR, 
                         p_dbid IN NUMBER, p_con_dbid IN NUMBER,
                         p_is_local IN VARCHAR, p_is_pdb IN VARCHAR,
                         p_is_old IN VARCHAR, p_time_limit IN VARCHAR)
  RETURN   XMLTYPE;

  -- ------------------------------------------------------------------------
  -- ------------------------------------------------------------------------
  -- fetch_obj_name
  --   Returns the fully qualified name of an object and its type as 
  --   an XML element.
  -- Subject to time limit: may return NULL if no time is left.
  -- p_obj_id: the ID of the segment.
  -- p_is_local: 'y' if the data is from the RDBMS we query
  --             any other value indicates an imported AWR snapshot
  -- p_dbid and p_con_dbid: In case of a local (p_is_local = 'y') p_dbid
  --             is the root's dbid and p_con_dbid is the PDB's dbid.
  --             p_con_dbid can be null in case of old RDBMS, or in case
  --             we are using a standard RDBMS.
  -- p_local_type: determines what RDBMS we are connected to (local)
  --               'ROOT' is the root of a CDB
  --               'PDB' is a PDB
  --               All other values mean a standard RDBMS
  -- p_is_old: 'y' if the local RDBMS version is 12.1 or below. 
  -- p_time_limit: 'y' if we are bound by time limit. 
  --
  -- We may search for object in various places depending on the situation.
  --   a. Dictionary (dba_objects or cdb_objects)
  --      dba_objects is moderately expensive to try
  --      cdb_objects is very expensive: should be tried last
  --   b. Local AWR using awr_pdb_seg_stat_obj or dba_hist_seg_stat_obj
  --      This is the cheapest data source. Should be tried first.
  --   c. Object link AWR (when inside a PDB and looking at the root).
  --      View is awr_root_seg_stat_obj (versions 12.2 and above) or 
  --      dba_hist_seg_stat_obj in version 12.1
  --      This is very expensive.
  -- 
  -- Order of search for the various cases:
  --
  -- A. Local snapshots, CDB Root:
  --    1. AWR(obj_id, root_dbid, con_dbid, 'DBA_HIST')
  --    2. Dictionary(obj_id, con_dbid, CDB_OBJECTS)
  -- 
  -- B. Local Snapshots, Non-CDB DB:
  --    1. AWR(obj_id, dbid, 'DBA_HIST')
  --    2. Dictionary(obj_id, DBA_OBJECTS)
  -- 
  -- C. Local Snapshots, PDB versions 12.1 and below
  --    1. Dictionary(obj_id, DBA_OBJECTS)
  --    2. AWR(obj_id, root_dbid, con_dbid, 'DBA_HIST')
  -- 
  -- D. Local snapshots, PDB versions 12.2 and above
  --    1. AWR(obj_id, con_dbid, 'AWR_PDB')
  --    2. Dictionary(obj_id, DBA_OBJECTS)
  --    3. AWR(obj_id, root_dbid, con_dbid, 'AWR_ROOT')
  -- 
  -- E. Imported snapshots, CDB root, standard RDBMS
  --    1. AWR(obj_id, dbid, con_dbid, 'DBA_HIST')
  -- 
  -- F. Imported Snapshots, inside PDB
  --    1. AWR(obj_id, dbid, con_dbid, 'AWR_PDB')
  -- ------------------------------------------------------------------------
  -- ------------------------------------------------------------------------
  FUNCTION fetch_obj_name(p_obj_id IN NUMBER, p_dbid IN NUMBER,
                          p_con_dbid IN NUMBER, p_is_local IN VARCHAR,
                          p_local_type IN VARCHAR, p_is_old IN VARCHAR,
                          p_time_limit IN VARCHAR)
  RETURN   XMLTYPE;

  -- ------------------------------------------------------------------------
  -- ------------------------------------------------------------------------
  -- fetch_procedure_name 
  --   Returns the full qualified PL/SQL procedure name (if found) 
  -- Subject to time limit: may return NULL if no time is left.
  -- This can only run on local DB - looks at dictionary
  -- ROOT: look at cdb_procedures
  -- PDB/standard DB: look at dba_procedures
  -- ------------------------------------------------------------------------
  -- ------------------------------------------------------------------------
  FUNCTION fetch_procedure_name(p_obj_id IN NUMBER, p_subobj_id IN NUMBER,
                                p_con_dbid IN NUMBER, p_time_limit IN VARCHAR)
  RETURN VARCHAR;

  -- ------------------------------------------------------------------------
  -- ------------------------------------------------------------------------
  -- fetch_user_name 
  --   Returns the user name (if found) 
  -- Subject to time limit: may return NULL if no time is left.
  -- This can only run on local DB - looks at dictionary
  -- ROOT: look at cdb_users
  -- PDB/standard DB: look at dba_users
  -- ------------------------------------------------------------------------
  -- ------------------------------------------------------------------------
  FUNCTION fetch_user_name(p_user_id IN NUMBER, p_con_dbid IN NUMBER,
                           p_time_limit IN VARCHAR)
  RETURN VARCHAR;

  -- ------------------------------------------------------------------------
  -- ------------------------------------------------------------------------
  -- getVersion
  --   Returns the version of the package
  -- ------------------------------------------------------------------------
  -- ------------------------------------------------------------------------
  FUNCTION getVersion RETURN VARCHAR;

  -- ------------------------------------------------------------------------
  -- ------------------------------------------------------------------------
  -- getData
  --   Single API for all other public functions in this package.
  --  "data_type"
  --     specifies which type of API is to be used. accepted values are:
  --     "data" for ASH data
  --     "timepicker" for the Time Picker graph
  --     "histogram" for a filtered time picker.
  --     "version" for getting just the package version
  --     "awr" for getting AWR info
  --     "cpu" for getting CPU info
  --     If an invalid value is given, ORA-20001 is raised as an error.
  --  "time_type"
  --     specifies how the time period is to be interpreted.
  --     (useful only for "data", "timepicker", "histogram") APIs
  --     "realtime" for all Real Time interfaces (from some time in the past to NOW)
  --     "incremental" for an increment over real time (bucket size must be defined)
  --     "historical" for a longer time period or a time period in the past (two time stamps)
  --     If an invalid value is given, ORA-20002 is raised as an error.
  --  "filter_list"
  --     is the filter used in the same way as the original package
  --  "args"
  --     contains the rest of the arguments in XML format.
  --     The xml format is as follows (example containing all valid arguments)
  --     If a mandatory argument is missing, ORA-20003 is raised as an error.
  --  
  --    <args>
  --       <dbid>87658765</dbid>
  --       <instance_number>1</instance_number>
  --       <time_since_sec>3600</time_since_sec>
  --       <begin_time_utc>07/23/2018 10:20:00</begin_time_utc>
  --       <end_time_utc>07/24/2018 08:30:00</end_time_utc>
  --       <bucket_size>30</bucket_size>
  --       <show_sql>n</show_sql>
  --       <verbose_xml>n</verbose_xml>
  --       <include_bg>n</include_bg>
  --       <minimize_cost>n</minimize_cost>
  --       <awr_info>n</awr_info>
  --       <resolution>medium</resolution>
  --    </args>
  --  
  --     Arguments that are not needed or that you wish to use the default values for,
  --     do not need to be specified in the XML doc.
  --     
  -- ------------------------------------------------------------------------
  -- ------------------------------------------------------------------------
  FUNCTION getData(data_type   VARCHAR2,
                   time_type   VARCHAR2,
                   filter_list VARCHAR2,
                   args        VARCHAR2
  ) RETURN XMLTYPE;

  -- ------------------------------------------------------------------------
  -- ------------------------------------------------------------------------
  -- getAWRInfo
  --   Returns information about AWR snapshots and ADDM Tasks
  --   p_dbid - specifies which dbid to look for
  --   p_inst_num - specifies the instance (if we want just one instance),
  --                use the default of NULL to get info on all instances
  --   p_begin_time_utc, p_end_time_utc - the time interval for information
  -- ------------------------------------------------------------------------
  -- ------------------------------------------------------------------------
  FUNCTION getAWRInfo(p_dbid IN NUMBER, p_begin_time_utc IN VARCHAR2,
                      p_end_time_utc IN VARCHAR2, p_inst_num IN NUMBER := NULL)
  RETURN XMLTYPE;

  -- ------------------------------------------------------------------------
  -- ------------------------------------------------------------------------
  -- getCPUInfo
  --   Returns information about availbale CPUs in XML format at a single 
  --   point in time.
  --    - dbid : specifies which db to look for, default (NULL) is DB we are
  --             conncted to.
  --    - observationTime : approximate time in which to look for data.
  --             default (NULL) is the latest possible data available 
  --             (NOW if possible).
  --    - ignore_cpu_history : when 'y', the API will not search for CPU 
  --             history from AWR
  -- If instance_number is NULL it means all instances. Otherwise, fetch 
  --  only data for the specified instance number.
  -- ------------------------------------------------------------------------
  -- ------------------------------------------------------------------------
  FUNCTION getCPUInfo(dbid IN NUMBER := NULL,
                      observationTime IN VARCHAR := NULL,
                      instance_number IN NUMBER := NULL,
                      ignore_cpu_history IN VARCHAR := 'n')
  RETURN XMLTYPE;

  -- ------------------------------------------------------------------------
  -- ------------------------------------------------------------------------
  -- getTimePickerRealTime
  --   Returns the time picker data for Real Time usage in XML format
  --   Time period is from NOW-time_since_sec to NOW. 
  --   The default time period is the last hour. 
  -- data is for entire database (all instances) we ara currently connected to
  -- ,foreground only, and in case we connect to a PDB - limited to that PDB.
  -- If instance_number is NULL it means all instances. Otherwise, fetch 
  --  only data for the specified instance number.
  --
  --  The format of the output is (example):
  --  <report> <report_parameters> ... </report_parameters>
  --  <awr_snaps>
  --    <snap snap_id="15" snap_time="11/27/2018 11:00:54" cnt_inst="1" 
  --          task_id="34" owner="SYS" task_name="ADDM:1997586511_1_15" 
  --          fdg_count="0"/>
  --    <snap snap_id="16" snap_time="11/27/2018 12:00:08" cnt_inst="1" 
  --          task_id="35" owner="SYS" task_name="ADDM:1997586511_1_16" 
  --          fdg_count="0"/>
  --  </awr_snaps>
  --  </report>
  --  An xml element of the list of snapshots is included as an option
  --  for all time picker reports over local data.
  --  The element's meaning:
  --  1. snap_id : the id of the AWR snapshot
  --  2. snap_time: the timestamp of the end time of the snapshot (i.e.
  --                the time the snapshot was taken). In case of RAC, it
  --                is the average time across all instances for the same
  --                snapshot
  --  3. cnt_inst: number of instances participating in the snapshot.
  --               In case the API is at instance level, this will be 
  --               always '1' even in RAC
  --  4. task_id: The id of the automatically generated ADDM task 
  --              associated with the snapshot (we choose the minimal 
  --              task_id in case there is more than one)
  --  5. owner, task_name: Another way to identify a task in advisor 
  --              framework. 
  --  6. fdg_count: the number of findings in the ADDM task
  --  7. resolution: valid values are 'low', 'medium', 'high', 'max' (or 'all')
  --        "reolution" control the number of buckets and rows per bucket.
  -- ------------------------------------------------------------------------
  -- ------------------------------------------------------------------------
  FUNCTION getTimePickerRealTime(
      time_since_sec IN NUMBER := 3600
    , show_sql       IN VARCHAR2 := 'n'
    , verbose_xml    IN VARCHAR2 := 'n'
    , instance_number IN NUMBER := NULL
    , awr_info IN VARCHAR2 := 'n'
    , ignore_cpu_history IN VARCHAR := 'n'
    , resolution      IN VARCHAR2 := 'medium'
    , include_bg      IN VARCHAR2 := 'n')
  RETURN XMLTYPE;

  -- ------------------------------------------------------------------------
  -- ------------------------------------------------------------------------
  -- incrementTimePicker
  --   Returns the time picker data for Real Time usage in XML format
  --   This function is used to get incremental data after the initial load.
  --   Incremental use case is only for Real Time.
  --   Time period is from begin_time_utc to NOW.
  --   There is no default time period. 
  --   The time is bucketized using bucket_size (in seconds). 
  --   The bucket boundaries are: 
  --     begin_time_utc, begin_time_utc+bucket_size, 
  --     begin_time_utc+2*bucket_size etc.
  -- If instance_number is NULL it means all instances. Otherwise, fetch 
  --  only data for the specified instance number.
  -- resolution: valid values are 'low', 'medium', 'high', 'max' (or 'all')
  --        "reolution" control the rows per bucket.
  -- ------------------------------------------------------------------------
  -- ------------------------------------------------------------------------
  FUNCTION incrementTimePicker(
      begin_time_utc IN VARCHAR2 
    , bucket_size    IN NUMBER 
    , show_sql       IN VARCHAR2 := 'n'
    , verbose_xml    IN VARCHAR2 := 'n'
    , instance_number IN NUMBER := NULL
    , awr_info IN VARCHAR2 := 'n'
    , resolution      IN VARCHAR2 := 'medium'
    , include_bg      IN VARCHAR2 := 'n')
  RETURN XMLTYPE;

  -- ------------------------------------------------------------------------
  -- ------------------------------------------------------------------------
  -- getTimePickerHistorical
  --   Returns the time picker data for historical in an XML format
  --   dbid determines which RDBMS to look for, default is the one we are
  --     connected to.
  --   Time period is one of the following
  --     a) From begin_time_utc to end_time_utc if both are specified.
  --     b) From NOW-time_since_sec to NOW (default is 24 hours)
  -- If instance_number is NULL it means all instances. Otherwise, fetch 
  --  only data for the specified instance number.
  -- resolution: valid values are 'low', 'medium', 'high', 'max' (or 'all')
  --        "reolution" control the number of buckets and rows per bucket.
  -- ------------------------------------------------------------------------
  -- ------------------------------------------------------------------------
  FUNCTION getTimePickerHistorical(
      dbid           IN NUMBER := NULL
    , begin_time_utc IN VARCHAR2 := NULL
    , end_time_utc   IN VARCHAR2 := NULL
    , time_since_sec IN NUMBER := 86400
    , show_sql       IN VARCHAR2 := 'n'
    , verbose_xml    IN VARCHAR2 := 'n'
    , instance_number IN NUMBER := NULL
    , awr_info       IN VARCHAR2 := 'n'
    , ignore_cpu_history IN VARCHAR := 'n'
    , resolution      IN VARCHAR2 := 'medium'
    , include_bg      IN VARCHAR2 := 'n')
  RETURN XMLTYPE;

  -- ------------------------------------------------------------------------
  -- ------------------------------------------------------------------------
  -- getHistogramRealTime
  --   Returns the ASH histogram for Real Time Usage in an XML format
  --   Time period is from NOW-time_since_sec to NOW (default is one hour)
  --   The data can be filtered using the filter list.
  -- data is for entire database (all instances) we ara currently connected to
  -- ,foreground only, and in case we connect to a PDB - limited to that PDB.
  -- If instance_number is NULL it means all instances. Otherwise, fetch 
  --  only data for the specified instance number.
  -- resolution: valid values are 'low', 'medium', 'high', 'max' (or 'all')
  --        "reolution" control the number of buckets and rows per bucket.
  -- ------------------------------------------------------------------------
  -- ------------------------------------------------------------------------
  FUNCTION getHistogramRealTime(
      filter_list     IN VARCHAR2 := NULL
    , time_since_sec  IN NUMBER := 3600
    , show_sql        IN VARCHAR2 := 'n'
    , verbose_xml     IN VARCHAR2 := 'n'
    , include_bg      IN VARCHAR2 := 'n'
    , instance_number IN NUMBER := NULL
    , ignore_cpu_history IN VARCHAR := 'n'
    , resolution      IN VARCHAR2 := 'medium')
  RETURN XMLTYPE;

  -- ------------------------------------------------------------------------
  -- ------------------------------------------------------------------------
  -- incrementHistogram
  --   Returns the ASH histogram for Real Time usage in XML format
  --   This function is used to get incremental data after the initial load.
  --   Incremental use case is only for Real Time.
  --   Time period is from begin_time_utc to NOW.
  --   There is no default time period. 
  --   The time is bucketized using bucket_size (in seconds). 
  --   The bucket boundaries are: 
  --     begin_time_utc, begin_time_utc+bucket_size, 
  --     begin_time_utc+2*bucket_size etc.
  --   The data can be filtered using the filter list.
  -- If instance_number is NULL it means all instances. Otherwise, fetch 
  --  only data for the specified instance number.
  -- resolution: valid values are 'low', 'medium', 'high', 'max' (or 'all')
  --        "reolution" control the rows per bucket.
  -- ------------------------------------------------------------------------
  -- ------------------------------------------------------------------------
  FUNCTION incrementHistogram(
      filter_list    IN VARCHAR2 := NULL
    , begin_time_utc IN VARCHAR2
    , bucket_size    IN NUMBER
    , show_sql       IN VARCHAR2 := 'n'
    , verbose_xml    IN VARCHAR2 := 'n'
    , include_bg      IN VARCHAR2 := 'n'
    , instance_number IN NUMBER := NULL
    , resolution      IN VARCHAR2 := 'medium')
  RETURN XMLTYPE;

  -- ------------------------------------------------------------------------
  -- ------------------------------------------------------------------------
  -- getHistogramHistorical
  --   Returns the ASH histogram for historical usage in an XML format
  --   dbid determines which RDBMS to look for, default is the one we are
  --     connected to.
  --   Time period is one of the following
  --     a) From begin_time_utc to end_time_utc if both are specified.
  --     b) From NOW-time_since_sec to NOW (default is 24 hours)
  --   The data can be filtered using the filter list.
  -- If instance_number is NULL it means all instances. Otherwise, fetch 
  --  only data for the specified instance number.
  -- resolution: valid values are 'low', 'medium', 'high', 'max' (or 'all')
  --        "reolution" control the number of buckets and rows per bucket.
  -- ------------------------------------------------------------------------
  -- ------------------------------------------------------------------------
  FUNCTION getHistogramHistorical(
      dbid            IN NUMBER := NULL
    , filter_list     IN VARCHAR2 := NULL
    , begin_time_utc  IN VARCHAR2 := NULL
    , end_time_utc    IN VARCHAR2 := NULL
    , time_since_sec  IN NUMBER := 86400
    , show_sql        IN VARCHAR2 := 'n'
    , verbose_xml     IN VARCHAR2 := 'n'
    , include_bg      IN VARCHAR2 := 'n'
    , instance_number IN NUMBER := NULL
    , ignore_cpu_history IN VARCHAR := 'n'
    , resolution      IN VARCHAR2 := 'medium')
  RETURN XMLTYPE;

  -- ------------------------------------------------------------------------
  -- ------------------------------------------------------------------------
  -- getDataRealTime
  --   Returns the ASH data for Real Time Usage in an XML format
  --   Time period is from NOW-time_since_sec to NOW (default is one hour)
  --   The data can be filtered using the filter list.
  -- data is for entire database (all instances) we ara currently connected to
  -- ,foreground only, and in case we connect to a PDB - limited to that PDB.
  -- If instance_number is NULL it means all instances. Otherwise, fetch 
  --  only data for the specified instance number.
  -- Minimize_cost: If set to 'y', 
  --                a. the time budget for additional information is 0.
  --                b. on disk data is disabled
  -- resolution: valid values are 'low', 'medium', 'high', 'max' (or 'all')
  --        "reolution" control the number of buckets and rows per bucket.
  -- ------------------------------------------------------------------------
  -- ------------------------------------------------------------------------
  FUNCTION getDataRealTime(
      filter_list     IN VARCHAR2 := NULL
    , time_since_sec  IN NUMBER := 3600
    , show_sql        IN VARCHAR2 := 'n'
    , verbose_xml     IN VARCHAR2 := 'n'
    , include_bg      IN VARCHAR2 := 'n'
    , instance_number IN NUMBER := NULL
    , minimize_cost   IN VARCHAR2 := 'n'
    , resolution      IN VARCHAR2 := 'medium')
  RETURN XMLTYPE;

  -- ------------------------------------------------------------------------
  -- ------------------------------------------------------------------------
  -- incrementData
  --   Returns the ASH data for Real Time usage in XML format
  --   This function is used to get incremental data after the initial load.
  --   Incremental use case is only for Real Time.
  --   Time period is from begin_time_utc to NOW.
  --   There is no default time period. 
  --   The time is bucketized using bucket_size (in seconds). 
  --   The bucket boundaries are: 
  --     begin_time_utc, begin_time_utc+bucket_size, 
  --     begin_time_utc+2*bucket_size etc.
  --   The data can be filtered using the filter list.
  -- If instance_number is NULL it means all instances. Otherwise, fetch 
  --  only data for the specified instance number.
  -- Minimize_cost: If set to 'y', 
  --                the time budget for additional information is 0.
  -- resolution: valid values are 'low', 'medium', 'high', 'max' (or 'all')
  --        "reolution" control the rows per bucket.
  -- ------------------------------------------------------------------------
  -- ------------------------------------------------------------------------
  FUNCTION incrementData(
      filter_list    IN VARCHAR2 := NULL
    , begin_time_utc IN VARCHAR2
    , bucket_size    IN NUMBER
    , show_sql       IN VARCHAR2 := 'n'
    , verbose_xml    IN VARCHAR2 := 'n'
    , include_bg      IN VARCHAR2 := 'n'
    , instance_number IN NUMBER := NULL
    , minimize_cost   IN VARCHAR2 := 'n'
    , resolution      IN VARCHAR2 := 'medium')
  RETURN XMLTYPE;

  -- ------------------------------------------------------------------------
  -- ------------------------------------------------------------------------
  -- getDataHistorical
  --   Returns the ASH data for historical usage in an XML format
  --   dbid determines which RDBMS to look for, default is the one we are
  --     connected to.
  --   Time period is one of the following
  --     a) From begin_time_utc to end_time_utc if both are specified.
  --     b) From NOW-time_since_sec to NOW (default is 24 hours)
  --   The data can be filtered using the filter list.
  -- If instance_number is NULL it means all instances. Otherwise, fetch 
  --  only data for the specified instance number.
  -- Minimize_cost: If set to 'y', 
  --                the time budget for additional information is 0.
  -- resolution: valid values are 'low', 'medium', 'high', 'max' (or 'all')
  --        "reolution" control the number of buckets and rows per bucket.
  -- ------------------------------------------------------------------------
  -- ------------------------------------------------------------------------
  FUNCTION getDataHistorical(
      dbid            IN NUMBER := NULL
    , filter_list     IN VARCHAR2 := NULL
    , begin_time_utc  IN VARCHAR2 := NULL
    , end_time_utc    IN VARCHAR2 := NULL
    , time_since_sec  IN NUMBER := 86400
    , show_sql        IN VARCHAR2 := 'n'
    , verbose_xml     IN VARCHAR2 := 'n'
    , include_bg      IN VARCHAR2 := 'n'
    , instance_number IN NUMBER := NULL
    , minimize_cost   IN VARCHAR2 := 'n'
    , resolution      IN VARCHAR2 := 'medium')
  RETURN XMLTYPE;


As the package body isn't wrapped at all, it's easy to search for implementation details there also.

2020-06-25

Draw an GANTT chart of how your workload fits together


In this Post I try tho provide a different view on ASH.
Again I'm focussed more on a specific user experience than general system overview.
The Idea again is from Cary Millsap - for details see this Youtube Video.

This time I rely on a script from my post Oceans, Islands, and Rivers in ASH and will show how it can provide a GANTT diagram of a specific user experience.

I created 2 dummy experiences - both by a user A. With a small extension of the yesterdays script and a filter on only this user_id and only current samples, 
...
WHERE 1=1 
  AND USER_ID=111
  AND SAMPLE_ID > 293910
...
the result is

It shows 17 different sessions which were active at some time. And with some experience and good imagination, the 2 different experiences can be separated. 
But as my testcases are properly instrumented, with an additional filter it's easy to show only the one experience I'm interested in.
...
WHERE 1=1 
  AND USER_ID=111
  D SAMPLE_ID > 293910
    AND CLIENT_ID='R1'
...

This shows only those 7 lines which matches my CLIENT_ID='R1' user experience. 
It also shows 4 parallel proceses in lines 3-6. 2 of them completed slightly faster. 
Because of these parallel processes, the user experience is 816 seconds, but DB-time is 1195 seconds! (Another reason why simple aggregates on ASH are often misleading). 

This result can be used as a starting point for further investigation - often together with the applications responsible. 

The full statement is here, the GANTT_LENGTH defines how many characters the Gantt diagram should have for better visibility.
WITH CONST as (
SELECT /*+ qb_name(CONST) */
    100 as GANTT_LENGTH -- unit: characters
  , 1   as RIVER_WIDTH  -- unit: sample_periode of ASH. --everything else IDLE is an OCEAN
FROM DUAL  
) ,FILTER_FIRST as (
SELECT /*+ qb_name('FILTER_FIRST') */  ash.* 
FROM gv$active_session_history ash
WHERE 1=1 
--  AND USER_ID=123
--  AND ....
--  AND SAMPLE_ID < 487871 -->
--  AND CLIENT_ID='R1'
), ISLANDS as (
SELECT /*+ qb_Name('ISLANDS') */
      min(BEGIN_SAMPLE_ID) OVER () total_min_sample_ID
   ,  max(END_SAMPLE_ID) OVER () total_max_sample_ID      
   ,   BEGIN_SAMPLE_ID
   ,  END_SAMPLE_ID
   ,  END_SAMPLE_ID - BEGIN_SAMPLE_ID +1  as ISLAND_LENGTH
   ,  ACTIVE_COUNT
   ,  inst_id
   ,  session_id
   ,  session_serial#
FROM FILTER_FIRST ff
       MATCH_RECOGNIZE(
         PARTITION BY inst_id, session_id, session_serial#
         ORDER BY SAMPLE_ID 
         MEASURES 
           first(SAMPLE_ID) as BEGIN_SAMPLE_ID,
           LAST(sample_id)  as END_SAMPLE_ID,
           COUNT(sample_id) as ACTIVE_COUNT
         ONE ROW PER MATCH
         PATTERN( frst cont*)
         DEFINE cont as SAMPLE_ID - prev(SAMPLE_ID) <= (SELECT RIVER_WIDTH FROM CONST)  -->
       )  
), DERIVED as (
SELECT /*+ qb_name (DERIVED) */ 
 (select (total_max_sample_id - total_min_sample_id) / ( SELECT GANTT_LENGTH FROM CONST)
   FROM ISLANDS
   WHERE rownum =1) as divisor
FROM DUAL
)
SELECT i.begin_sample_id
     , i.end_sample_id
     , i.inst_id
     , i.session_id
     , i.session_serial#
     , rpad('>', trunc( (begin_sample_id - total_min_sample_ID)/ d.divisor ,1)+1, ' ') || 
         rpad('*',ceil(island_length/ d.divisor) ,'*') AS GANTT
from ISLANDS i
   , DERIVED d
WHERE     END_SAMPLE_ID - BEGIN_SAMPLE_ID +1 > 2   
ORDER BY BEGIN_SAMPLE_ID, ISLAND_LENGTH, INST_ID, SESSION_ID
/
and is also availalbe on github.

2020-06-24

Oceans, Islands, and Rivers in ASH

The Idea of Oceans, Islands and Rivers in performance data from Oracle sessions comes from Cary Millsap. I recommend reading his Presentation - especially page 33+. 
To summarize it very short: in an ocean of idle states (where the application doesn't interact with the session at all) there are islands of activity, but within these islands, there still can be rivers of idle events - when there is communication between the server process and the application. 

Even the algorithm was defined for trace data, I'm sure it can be implemented based on ASH data. Of course, the resolution isn't as fine as trace data, but if only big islands are of interest, and these islands doesn't have to many rivers, sampled ASH sould be acceptable.

This can be done quite easy with a statement like this.
I tried to keep it simple by having a CONST CTE at the beginning. there the RIVER_WIDTH can be set. It defines how many idle (non visible) samples define the widest river. Everything greater is an ocean which separates islands. 
In the 2nd CTE FILTER_FIRST, additional filters can be applied to ASH. Everything which narrows the focus can help, like USER_ID, SAMPLE_ID or timestamps. The idea matches proper scoping in SQL*Trace.

WITH CONST as (
SELECT /*+ qb_name(QB_CONST) */
    100 as GANTT_LENGTH -- unit: characters
  , 1   as RIVER_WIDTH  -- unit: sample_periode of ASH. --everything else IDLE is an OCEAN
FROM DUAL  
) ,FILTER_FIRST as (
SELECT /*+ qb_name(QB_FILTER_FIRST) */  ash.* 
FROM gv$active_session_history ash
WHERE 1=1 
--  AND USER_ID=123
--  AND ....
--  AND SAMPLE_ID < 487871
), ISLANDS as (
SELECT /*+ qb_Name(QB_ISLANDS) */
      min(BEGIN_SAMPLE_ID) OVER () total_min_sample_ID
   ,  max(END_SAMPLE_ID) OVER () total_max_sample_ID      
   ,   BEGIN_SAMPLE_ID
   ,  END_SAMPLE_ID
   ,  END_SAMPLE_ID - BEGIN_SAMPLE_ID +1  as ISLAND_LENGTH
   ,  ACTIVE_COUNT
   ,  inst_id
   ,  session_id
   ,  session_serial#
FROM FILTER_FIRST ff
       MATCH_RECOGNIZE(
         PARTITION BY inst_id, session_id, session_serial#
         ORDER BY SAMPLE_ID 
         MEASURES 
           first(SAMPLE_ID) as BEGIN_SAMPLE_ID,
           LAST(sample_id)  as END_SAMPLE_ID,
           COUNT(sample_id) as ACTIVE_COUNT
         ONE ROW PER MATCH
         PATTERN( frst cont*)
         DEFINE cont as SAMPLE_ID - prev(SAMPLE_ID) <= (SELECT RIVER_WIDTH FROM CONST) 
       )  
)
SELECT /*+ qb_name(QB_MAIN)*/ isl.begin_sample_id
     , isl.end_sample_id
     , isl.island_length
     , isl.active_count
     , isl.inst_id
     , isl.session_id
     , isl.session_serial#
FROM ISLANDS isl
Order by isl.begin_sample_id
        , isl.inst_id
        , isl.session_id
/
The result on my sandbox is like this:

BEGIN SAMPLE_ID END SAMPLE_ID ISLAND LENGTH ACTIVE COUNT INST ID SESSION ID SESSION SERIAL#
487760 487776 17 17 1 21 6605
487777 487780 4 4 1 274 7693
487781 487782 2 2 1 264 65268
487785 487785 1 1 1 278 22792
487791 487792 2 2 1 22 17104
487794 487794 1 1 1 22 37292
487795 487795 1 1 1 284 36814
487796 487797 2 2 1 278 22792
487798 487798 1 1 1 22 37292
487800 487800 1 1 1 31 44098
487800 487803 4 4 1 278 22792
487802 487875 74 71 1 22 37292
487807 487807 1 1 1 282 7351

BEGIN_SAMPLE_ID, END_SAMPLE_ID, INST_ID, SESSION_ID and SESSION_SERIAL# together describe every single island. It can be userd later on to do specific analysis on this island. 
ISLAND_LENGTH show the total length of the island, and ACTIVE_COUNT is the amount of "land" on this island. The lower this number, the more rivers were found. 

This can be a total different approach to analyse ASH data.

2020-06-23

sampling everything

Oracle ASH is a great tool! 
It's on by default, and (when properly licensed) can give a lot of information about a system.
Unfortunately there are some drawbacks. One is the limited information for users experience, when part of the work is spent outside of the instance (and it's subsystems like disk-IO). Normally this part is spent on application side. 
Oracle indicates this with wait event SQL*Net message from client. As this wait event belongs to the wait class idle, it's not visible in ASH for a simple reason: ASH stands for Active Session History.  And idle just doesn't count as active. 
In my previous post I shortly explained why idle stati can be of some interest from users experience perspective. 

There is a parameter which transforms ASH into ALL Session History:

_ash_sample_all = TRUE

With this undocumented (and unsupported) setting, all sessions (not only those not idle) are sampled and the sample are written into ASH memory ring buffer. 
(There are more ash related undocumented parameters

On my sandbox system a small test created these entries:

SAMPLE_ID SQL_ID EVENT SEQ# WAIT_CLASS
485161   ON CPU 8  
485162 30kanbhk5wg4m SQL*Net message from client 32 Idle
485163 30kanbhk5wg4m SQL*Net message from client 32 Idle
485164 817dp83nj72zp ON CPU 32  
485165   SQL*Net message from client 36 Idle
485166   SQL*Net message from client 36 Idle


This corresponds quite well with the matching tracefile (filtered for SQL*Net message form client

WAIT #139691636527808: nam='SQL*Net message from client' ela= 22382 driver id=1413697536 #bytes=1 p3=0 obj#=-1 tim=740940045
WAIT #139691636521672: nam='SQL*Net message from client' ela= 217489 driver id=1413697536 #bytes=1 p3=0 obj#=-1 tim=741185838
WAIT #139691636521672: nam='SQL*Net message from client' ela= 11484 driver id=1413697536 #bytes=1 p3=0 obj#=-1 tim=741200014
WAIT #139691637134592: nam='SQL*Net message from client' ela= 2241071 driver id=1413697536 #bytes=1 p3=0 obj#=-1 tim=743459220
WAIT #139691636521672: nam='SQL*Net message from client' ela= 11994 driver id=1413697536 #bytes=1 p3=0 obj#=-1 tim=743475271
WAIT #0: nam='SQL*Net message from client' ela= 2223365 driver id=1413697536 #bytes=1 p3=0 obj#=-1 tim=745699337
  
In this specific case we can match the event of sample_id 485162 and 485163 (it is the same event, as seq# doesn't change) matches the 4th line of the trace excerpt (the one which lasts 2241071 ). 
The event of samles 485165 and 485166 match to the last line in the trace excerpt - ela= 2223365


Of course putting additional load onto the system comes at some risk. Let's consider how risky it is - especially if enabled for short time for specific analysis.

First a busy system where most sessions are active doing some work. 
In this instance most of the sessions are sampled anyhow - because active. The additional idle samples only add a relative small amount of lines - little additional load. 

Next a system where most sessions are idle. 
In this instance, much more lines will appear in ASH. Initially this can be seend as dangerous load. 
But all these idle sessions can become active anyhow - in worst case all together. 
If the instance is sized for the load of most sessions active, writing ALL sessions information to ASH will not hurt while it's idle. If the instance is NOT sized for the sessions coming active, the system is in high structural danger anyhow. 
 
Still another detail sould be cared of: ASH is written to AWR at some time - which will lead to more storage used when enabled for longer time. 


When compared with DBMS_MONITOR.DATABASE_TRACE_ENABLE, both methods have slightly different impact. When the system is busy, it will have a lot of quite fast wait events. A lot will be written to tracefiles and many lines will appear in ASH. 
But when the system has events which last quite long (as the 2 events in my example ago) they will create only one entry in the tracefile, but more lines in ASH. 

2020-06-20

comparison between SQL*TRACE and ASH - get the right information

I'm quite interested in analyzing and improving Performance in Oracle databases. 
There are different approaches. A lot was discussed already if tracing or sampling is appropriate. Namely SQL*Trace or ASH/AWR. 
I will not favor one side here, just pick one aspect and compare both methods. 

Todays aspect is to compare how a specific user experience can be identified. As samples (ASH) are always enabled, it means to filter the right data out of this heap of data; In SQL*Trace it's to scope what or where SQL*Trace should be enabled. 

As I'm a lazy guy, I refer to Cary Millsaps Mastering Oracle Trace Data. In my copy of the book, Chapter 3 (Tracing Oracle) he shows an ordered list of tracing preferences. I will follow this list:

  1. If the application set a distinct client ID for each business task execution ...
    SQL*Trace can be enabled by DBMS_MONITOR.CLIENT_ID_TRACE_ENABLE
    ASH can be filtered on column CLIENT_ID
  2. If the application set a distinct module and action name ... 
    SQL*Trace can be enabled by DBMS_MONITOR.SERV_MODE_ACT_TRACE_ENABLE
    ASH can be filtered on columns MODULE and ACTION
  3. If the program run long enough to be identified ... and still run long enough ... 
    SQL*Trace can be enabled for this session by DBMS_MONITOR.SESSION_TRACE_ENABLE 
    ASH can be filtered on columns SESSION_ID and SESSION_SERIAL# 
  4. If there is any x such as SYS_CONTEXT('USERENV', x)  ...
    SQL*Trace can be enabled by an AFTER LOGON trigger
    ASH use this AFTER LOGON trigger to set CLIENT_ID, MODULE or ACTION and then filter on any of those
  5. If a new service can be created for the problematic experience ... 
    SQL*Trace can be enabled by DBMS_MONITOR.SERV_MODE_ACT_TRACE_ENABLE
    ASH can be filtered on column SERVICE_HASH (with a little join of DBA_SERVICES)
  6. If nothing else helps ... 
    SQL*Trace can be enabled for everything a short period of time by DBMS_MONITOR.DATABASE_TRACE_ENABLE and the user experience can be identified later
    ASH is on all the time, still the user experience mist be identified by the same investigation effort 

This comparison seems to be equal between SQL*Trace and ASH sampling. But I know of a small but specific difference: Wherever the user experience can not be accurately enabled by any setting, it must be filtered by other means. Here SQL*Trace has a big advantage, especially when investigated by a toolset like mrskew in Method-R Workbench: Some activities can be identified by specific start and stop statements, e.g. getting some parameters from a configuration table with a SELECT at the beginning, and write a trace line at the end. mrskew can be used to generate an artificial experience-ID for every experience between these 2 markers. In ASH, as the sampling might not catch any of these statements for a specific execution. This needs additional triggers on the statements to set any CLIENT_ID, MODULE or ACTION as in point 4 above. For sure more work in  this case, especially for SELECTs

My high level summary on identifying the users experience: both SQL*Trace and ASH are comparable. The big advantage of ASH is it's always on implementation, whereas SQL*Trace has advantages when it's about specific SQLs as markers. 

2019-05-05

invisible IOs

My team identified an interesting case of invisible IOs this week. During some checks of system statistics graphs, something unexpected ocured:
One of those "small & unimportant" test DBs had an interesting IO pattern:


This was something interesting, so a colleague decided to have a deeper look at it. The next obvious step is to see if AAS shows anything interesting. And it does:


A lot of blue (which is used for IO in all tools I'm aware of) was expected, but it's obviously dominated by green (CPU). What a surprise!

After some quick crosschecks if any of the systems show fake data, we agreed it's all correct. Still the question exists: why does system statistics show a lot of IO, whereas ASH looks very different?

More data is needed, so one question was: out of all the direct path read IOs we saw in this timespawn, how fast were they? The first source for a check is DBA_HIST_SYSTEM_EVENT:
SELECT
    sysev.event_name,
    sysev.wait_class,
    MAX(total_waits) - MIN(total_waits) AS sum_total_waits,
    MAX(time_waited_micro) - MIN(time_waited_micro) AS sum_time_waited,
    ( MAX(time_waited_micro) - MIN(time_waited_micro) ) / ( MAX(total_waits) - MIN(total_waits) + 1) time_per_wait
FROM
    dba_hist_snapshot       snap,
    dba_hist_system_event   sysev
WHERE snap.snap_id = sysev.snap_id
    AND begin_interval_time BETWEEN to_timestamp('2019-05-03 06:00:00', 'YYYY-MM-DD HH24:MI:SS') 
                                AND to_timestamp('2019-05-03 20:00:00', 'YYYY-MM-DD HH24:MI:SS')
GROUP BY    GROUPING SETS (
        ( sysev.event_name,          sysev.wait_class ),
        ( sysev.wait_class )
    )
ORDER BY    3 DESC,    2,    1;


EVENT_NAME                     WAIT_CLASS      SUM_TOTAL_WAITS SUM_TIME_WAITED  TIME_PER_WAIT
------------------------------ --------------- --------------- --------------- --------------
                               User I/O              156659399     87378811924         557.76
                               System I/O            134570949     10821645896          80.42
                               Idle                   66603429 ###############     2432741.08
                               Network                65725910      5330619377          81.10
                               Administrative         20587618    191843235750        9318.38
direct path read               User I/O               10353091      2001455155         193.32
db file sequential read        User I/O                1008098       255164480         253.11
                               Other                    947941     10721785435       11310.59
control file sequential read   System I/O               472653        11995170          25.38
                               Application              460657        73815782         160.24
SQL*Net message from client    Idle                     303956    500628620721     1647037.64

The topmost User I/O event is direct path read. During the 14 hour period, it happened at about 200 times every second. Based on the ASH graph above we can assume it all happened in one session, so in this session every second about 40ms were spent in direct path read.
This now raises the question why these 40% (20200930: corrected due to a comment from John Beresniewicz) 4% of time are not visible in ASH? The best answer I found so far is described in ASHviz: Densities and dark matter by John Beresniewicz.
Short events are underrepresented in sampled data. And as one single direct path read lasted only 193μs on average, the observation was hit by this bias.
With this very simple test-DB it was possible to investigate the situation to a reasonable degree of understanding, But chasing the real producer of high IOs in a busy production system might be misleading when only ASH is used.


This situation is kind of a downer for me as ASH does not even close show the truth. (this is a good example, where tracing is better than sampling). So a reliable source for additional information is required.
In recent Oracle versions (10.1 or later) there is some information available: Of course v$sesstat shows statistics for every session, but the numbers are cumulative and must be processed somehow.
Oracle provides v$sessmetric for this purpose, but it only shows the last x seconds and only a small subset of statistics. A more generic solution is Tanel Põders snapper. But both approaches can only show what's going on at the time of observation.
For something more DBA_HIST_ish, DBA_HIST_SESSMETRIC_HISTORY looks promising, but it is misleading, as This view is populated only if a session metric exceeds a server metric threshold that was configured using the DBMS_SERVER_ALERT package.
There is much more about these features & their limitations in Kyle Hailys Oracle 10g Performance: chapter 04 new features.

With all that in mind, I hope for additional information about session statistic deltas. (SSD would be a perfect and unambiguous abbreviation 😅)
In short, it should write all changed session stats for all sessions at every snapshot. In addition for every closed session their statistics must be saved, otherwise their data is lost. Tanel implemented something similar already in his Session-level statspack but he decided not to store session statistics by default to save space. Also no logoff-trigger is there (yet).
Let's see if there will ever be a SSD implementation available.

2018-05-30

flipping performance

Recently I had a request to check "if there is any problem with the database at <specific times>".
You can imagine, there was no problem. Nothing in alert.log, no tracefiles, no locks or oddities in ASH/AWR.

I had to ask back & forth to get some more information about the issue. The information I got was:
"we use a statement SELECT * FROM table(some_function('P1', 'P2')) - and it took longer than 10 sec at the given times". Of course there were no bind variables used but constants every time.
This situation helps a lot as obviously there is nothing to do with SQL_IDs now, and the real issue is (probably) within the function.
The function just generated 1 SELECT (no BINDs again - but PL/SQL did the "auto-binding").
With this SQL it's easy to identify the SQL_ID.
This SQL_ID has 3 childs with different plans. That is sufficient to check, if the specific times somehow match a flip of plans. This was done by a simle query:

with gash as (
select sql_id, sql_child_number, sample_time, LAG(sql_child_number, 1, 0) OVER (ORDER BY sample_time) AS prev_child
from gv$active_session_history
where sql_id='&sql_id'
order by sample_time
)
select *
from gash
where sql_child_number != prev_child
order by sample_time

For a longer observation dba_hist_active_sess_history can be used as well.

The result easily showed a flip between childs/plans at the given times.

(solution was to generate "outline-hints" with dbms_xplan.display_cursor for the good plan and so hint the SQL inside of some_function).

This was no complex task to analyze or big deal to execute. Just a small example where GUIs might not help so much. By the (little) information given it would have been pure luck to see the problematic pattern in a ASH-graph. As ther was nothing to filter, all the other "noise" in the DB would have wiped the information out.

Sometimes it's good to know the architecture and views, not only the GUI.

PS: The statement above is ugly. A MATCH_RECOGNIZE would be more elegant. Unfortunately this DB is 11.2

2017-11-16

Backup stalled due to ASM rebalance stuck

I hit an issue where a full backup took much longer than normal.
In this case there was no alarm yet as no threshold was reached. But I worked on the DB for some other reason and out of a habit I most often start a ASH viewer whenever I work on a system - even if I only check data, it's worth to have an eye on the system.
In this case I saw some top session in waits 'ASM file metadata operation' & 'KSV master wait'.
It wasn't my query session (so I didn't break anything) but some RMAN worker processes.

That's worth to investigate. After some research (Google & MetaLink) I saw some links between ASM rebalance and 'ASM file metadata operation'.

Checking the ASM instance, there was really a ASM rebalance ongoing, but no progress (no change in v$asm_operation.SOFAR over some minutes). It was initiated the other evening by a colleague which added a disk to the DG. I agree with Kevin this is a bad habit, but in this environment it's not enough pain (and multiple teams involved) to re-work all the processes. The RBAL process was waiting in 'enq: RB - contention'.

As ASM rebalance can be stopped or re-started wit othe rpriority easily, I gave this a chance and run ALTER DISKGROUP dg REBALANCE POWER 2 - the power is not important here, ony to stop the current (stalled) rebalance and issue another.

The ASH viewer immediately showed the uncommon waits disappear and in RMAN logs I saw ordinary progress immediately.

To be honest I did not much analysis here, so it might be worth to do better, but in this case it was sufficient and the issue solved even before there was an alarm regarding the blocked backup.

Once again, ASH (and my curiosity) helped solving the issue.