In Oracle database the vie DBA_FEATURE_USAGE_STATISTICS is given to
display information about database feature usage statistics.
That's all I can find in The (12.1)
Docu.
Just in case anyone asks - DBA_FEATURE_USAGE_STATISTICS is not mentioned in the license guide at all:
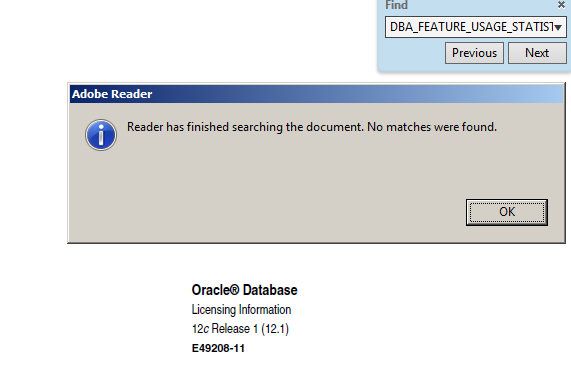
Still for me it's interesting what's behind the view, and how it's content is populated.
So I started to analyze it's anatomy.
Starting with the view definition (slightly rewritten for better readability):
SELECT samp.dbid,
       fu.name,
       samp.version,
       fu.detected_usages,
       samp.total_samples,
       Decode(To_char( last_usage_date,  'MM/DD/YYYY, HH:MI:SS'),
              NULL, 'FALSE',
              To_char( last_sample_date, 'MM/DD/YYYY, HH:MI:SS'),
              'TRUE', 'FALSE') currently_used,
       fu.first_usage_date,
       fu.last_usage_date,
       fu.aux_count,
       fu.feature_info,
       samp.last_sample_date,
       lsamp.ast_sample_period,
       samp.sample_interval,
       mt.description
FROM   wri$_dbu_usage_sample samp,
       wri$_dbu_feature_usage fu,
       wri$_dbu_feature_metadata mt
WHERE  samp.dbid = fu.dbid
       AND samp.version = fu.version
       AND fu.name = mt.name
       AND fu.name NOT LIKE '_DBFUS_TEST%'    /* filter out test features */
       AND Bitand(mt.usg_det_method, 4) != 4  /* filter out disabled features */
This view is quite simple, and all important columns of
wri$_dbu_usage_sample and
wri$_dbu_feature_usage are shown in the projection.
The filters are only to hide some rows used for internal testing.
So the interesting part are those columns of
wri$_dbu_feature_meatadata which are not shown.
In this table are 2 groups of columns:
The first group are the columns
INST_CHK_METHOD and
INST_CHK_LOGIC.
They describe if and how to check, if a detailed detection is needed at all.
INST_CHECK_METHOD has 3 possible values right now:
| DBU_INST_ALWAYS_INSTALLED | 1 | /* no test required */ |
| DBU_INST_OBJECT | 2 | /* object name in LOGIC */ |
| DBU_INST_TEST | 4 | /* only test */ |
DBU_INST_ALWAYS_INSTALLED means the test is run always. If
DBU_INST_OBJECT it's only tested, if the object in
INST_CHK_LOGIC exists.
The detection itself is described in the columns
USG_DET_METHOD and
USG_DET_LOGIC.
USG_DET_METHOD has 3 possible values:
| DBU_DETECT_BY_SQL | 1 | /* SQL specified in USG_DET_LOGIC */ |
| DBU_DETECT_BY_PROCEDURE | 2 | /* Procedure specified in USG_DET_LOGIC */ |
| DBU_DETECT_NULL | 4 | /* only test for _DBFUS_TEST_SQL_7 */ |
If it's set to
DBU_DETECT_BY_SQL, the SQL stored in
USG_DET_LOGIC is executed and it's result stored. In case it's
DBU_DETECT_BY_PROCEDURE, the procedure is called. It has 3 parameters (with different names, but the type is always the same):
Argument Name Type   In/Out Default
------------- ------ ------ -------
IS_USED       NUMBER OUT
DATA_RATIO    NUMBER OUT
CLOB_REST     CLOB   OUT
DATA_RATIO will be stored in
AUX_COUNT,
CLOB_REST in
FEATURE_INFO.
These infos should be sufficient to analyze everything inside and related to
DBA_FEATURE_USAGE_STATISTICS.
During the research I found 2 ways to do a immediate run of all tests. Instead of the default weekly run. Those update
wri$_dbu_feature_usage - so the results are stored.
The first one is to kick mmon to run the usage sampling out of schedule:
alter session set events 'immediate trace name mmon_test level 6';
The second method is to run the sampling in the current session. This is quite nice for any kind of tracing:
alter session set "_SWRF_TEST_ACTION"=53;
But be aware both methods can create a higher
DETECTED_USAGES than weeks between
FIRST_USAGE_DATE and
LAST_USAGE_DATE.
For a proper mapping between entries in DBA_FEATURE_USAGE_STATISTICS and options/packs there is a script
options_packs_usage_statistics.sql provided by My Oracle Support in
Database Options/Management Packs Usage Reporting for Oracle Databases 11gR2 and 12c (Doc ID 1317265.1)
