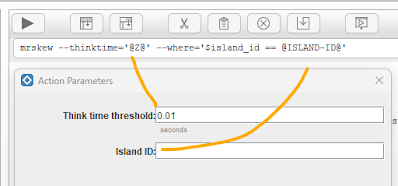
Method-R Workbench is a leading tool to analyze many aspects of Oracles SQL-Trace files.
It can use parameters in its commands and let users fill their values there. In the picture there are even 2 parameters, properly labeled and predefined.But when I run my own statement which also uses a "variable" of the same format, it only generates an error message:
mrskew --name='cell single block physical read$' --where='$obj==@OBJECT-ID@' --group='sprintf("%-16s %-16s", $p1, $p2 )'   --group-label='sprintf("%-16s %-16s", "p1", "p2" )'

Array found where operator expected at (eval 26) line 1, near "ID@)"
syntax error at (eval 26) line 1, near "ID@) "
	<diagnostic label="Response time time by p1 and p2 call name for a given OBJECT ID filtered for only 'cell single block physical read$'">	<!-- This is the name that the application will use for the report. -->
		<commandline>mrskew --name='cell single block physical read$' --where='$obj==@OBJECT-ID@' --group='sprintf("%-16s %-16s", $p1, $p2 )' --group-label='sprintf("%-16s %-16s", "p1", "p2" )'</commandline>				<!-- This is the command line. The token @SQLID@ is defined on the following line. -->
		<param token="@OBJECT-ID@" label="Object ID" hint="obj=" default="-1"/>				<!-- This element causes the app to pop a dialog using the field label, data entry tip, and default value. -->
		<sample><![CDATA[
p1               p2                DURATION       %  CALLS      MEAN       MIN       MAX
---------------------------------  --------  ------  -----  --------  --------  --------
4239709683       2452482353        0.341465    7.9%     12  0.028455  0.005255  0.209957
4239709683       560937342         0.235909    5.4%      7  0.033701  0.010636  0.122802
3429896051       3039011478        0.224350    5.2%      4  0.056088  0.008659  0.186996
4156894774       425700738         0.221344    5.1%      8  0.027668  0.010023  0.077580
437579672        4090241319        0.177895    4.1%      9  0.019766  0.000978  0.072990
3429896051       3648465545        0.166973    3.8%      8  0.020872  0.009399  0.029454
4156894774       203886304         0.164699    3.8%      7  0.023528  0.002680  0.097812
4156894774       1302812366        0.160810    3.7%      8  0.020101  0.007712  0.080382
4239709683       2857786178        0.159647    3.7%      9  0.017739  0.005672  0.068118
3429896051       2540343800        0.146400    3.4%      4  0.036600  0.018622  0.074485
                        37 others  2.340060   53.9%    157  0.014905  0.000342  0.128323
---------------------------------  --------  ------  -----  --------  --------  --------
                       TOTAL (47)  4.339552  100.0%    233  0.018625  0.000342  0.209957

		]]></sample>																<!-- This is what shows up in the Sample Output tab as you scroll through the reports list. -->
	</diagnostic>
Special thanks to Cary and Jeff for explaining these details so I can document it.


